Download
1 / 10
100 likes | 127 Views
12.5 Working with Samples 12.6 Binomial Distributions. There are admirable potentialities in every human being. Believe in your strength and your youth. Learn to repeat endlessly to yourself, 'It all depends on me.'. Samples and Populations.

E N D
12.5 Working with Samples 12.6 Binomial Distributions There are admirable potentialities in every human being. Believe in your strength and your youth. Learn to repeat endlessly to yourself, 'It all depends on me.'
Samples and Populations Sample – gathers info from only part of a population. Sample Proportion – the ratio , where x is the number of times an event occurs in sample size n. Random Sample – all members of a population are equally likely to be chosen (so this is a good representation of the population) Ex1) In a sample of 500 teenagers, 328 had never attended a popular music concert. Find the sample proportion for those who have never attended a concert. Write the answer as a percent.
Bias The Sunnyvale High School student council dance committee is trying to decide whether to have a band or a DJ for the fall dance. They decided that each of the three committee members should survey the students in their homeroom classes. Identify any bias in this sampling method. 1) This is a “convenience” sample that is convenient for the committee members. 2) Three homerooms may not accurately reflect the opinions of the entire school, because three homerooms is probably a low percentage of all the school’s homerooms. 3) This sampling method has a bias and is not random.
Margin of Error When a random sample of size n is taken from a large population, the sample proportion has a margin of error of about ***The larger the sample, the smaller the margin of error! We use margin of error to give us an interval that is likely to contain the true population proportion Ex2) An opinion poll about the popularity of the mayor has a margin of error of ±5%. Estimate the number of people who were surveyed.
Margin of Error • Ex3) A survey of 528 high school seniors found that 343 already had career plans after high school. • Find the margin of error for the sample. • b) Use the margin of error to find an interval that is likely to contain the true population proportion.
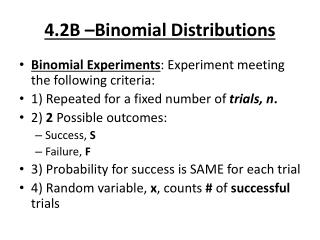
Binomial Experiments Binomial Experiments: -repeated trials -each trial has 2 possible outcomes (success or failure) -trials are independent (probability of success is constant throughout) # of successes # of failures trials probability of success probability of failure
Binomial Probability Ex4) Brittany makes 90% of the free throws that she attempts. Find the probability that she will make exactly 6 out of 10 consecutive free throws.
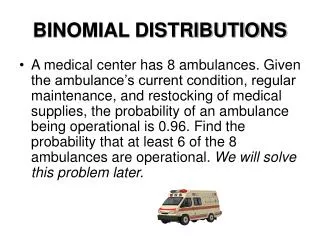
Binomial Distribution Ex5) One survey found that 80% of respondents eat corn on the cob in circles rather than from side to side. Assume that this sample accurately represents the population. What is the probability that, out of 4 people, at least 2 of them eat corn on the cob in circles?
12.5 Working with Samples 12.6 Binomial Distributions 12.5 #1-6, 9-11, 15-19, 22, 24 12.6 #8, 10, 15-20, 22 There are admirable potentialities in every human being. Believe in your strength and your youth. Learn to repeat endlessly to yourself, 'It all depends on me.'
Binomial Distribution 3 4 3 P (three prizes) = 1 = 0.422 3 4 1 4 2 P (two prizes) = 3 = 0.422 3 4 1 4 1 2 P (one prize) = 3 = 0.141 1 4 3 P (no prize) = 1 = 0.016 Ex 6) A fast food restaurant is attaching prize cards to every one of its soft drink cups. The restaurant awards free drinks as prizes on three out of four cards. Suppose you have three cards. Find the probability that exactly one of these cards will reveal a prize using a tree diagram. The probability that exactly one of three cards will reveal a free drink is about 14%.