Download
1 / 19
190 likes | 337 Views
The Effect of Observing Environment on Temperature in North China Plain Area. Jianxia Guo 1 , Xin Li 2 1. Meteorological Observation Center of CMA, Beijing, China; 2. Nanjing University of Information Science & Technology, Nanjing, China. outline. Questions

E N D
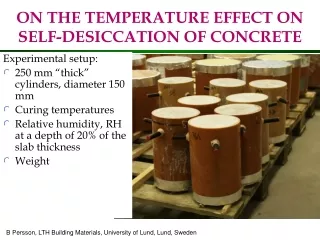
The Effect of Observing Environment on Temperature in North China Plain Area Jianxia Guo1, Xin Li2 1. Meteorological Observation Center of CMA, Beijing, China; 2. Nanjing University of Information Science & Technology, Nanjing, China
outline • Questions • Research region and sites • Classify the observing environment • Data processing • Analysis • Summary • Discussions
Questions • In China, we usually restrict the ratio of distance to height of surroundings to protect a surface observing station. Is it enough to protect a station for climate monitoring? • From sitting classification document, the class 1 sites for air temperature request 100m from buildings, concrete surfaces, etc, and below 5°projected shade. Dose these requests guarantee the accuracy and representative of climate observation? • We want a reference station to reflect a large scale climate conditions. Which scale of environment will affect the most to the air temperature observation? Can we detect and quantify the environmental influence from the operational observation?
Research region and sites Huang-huai-hai-Wei-he climate region 402,400 km2; Plain; Farmlands 74%; Urban area 17.6%; 374 surface stations, with 8 reference stations 54 basic stations 312 ordinary stations 31 relocated sites and 11 above 500m sites are not concerned.
Classify Observing Environments • CMA did a comprehensive survey to 2435 surface stations in 2007. By the results of field survey, we classified the observing environments at three scales: • 20km— mesoscale • Urban stations: Urban area > 60%. 75 stations • Farmland stations: Farmland area>60%. 124 stations. 53.21% of the total stations Farmland station (Wenan) Urban station (Beijing)
5km—local scale • Group 1: Farmland area>60% within 5km, and surrounded by natural land. 24 stations. • Group2: Farmland area>60% within 5km, and surrounded by construction area. 7 stations. • Group3: Building area>60% within 5km, and surrounded by natural land. 59 stations. • Group4: Building area>60% within 5km, and surrounded by construction area. 13 stations. 24 stations 7 stations 59 stations 13 stations
Shade projected area—microscale Shade area=(front elevation + the next elevation)*angular width/2 (°2)
Date Processing • Latitude, longitude and altitude corrections Where, T' is the corrected site temperature, T0 the temperature observed at the site. represents the latitudes, longitudes and altitudes at the reference points, respectively. N, E, H stands for the station’s latitude, longitude and altitude, respectively. k1, k2, k3 shows the temperature variability over latitude, longitude and altitude.
Fig. 1. Regional anomaly of temperature in 199 stations during 2005-2007 (unit: ℃; red dot: residential stations; black dot: farmland stations) Left: before revised, right: after revised
Analysis • Mesoscale environmental influence • Annually, monthly, hourly average temperature difference between two types stations. • The temperature difference variation with the increase of two typical land use cover. • Local scale environmental influence • The temperature difference between different local land use type with similar surroundings. • The temperature difference between same local land use type with different surroundings. • Shade project area influence • The temperature difference between different shade area grads.
Mesoscale environmental influence The average value 0f three years Annually: 0.662℃; Monthly max:0.35 ℃ mean: 0.66 ℃ min: 0.93 ℃ Fig. 2. Regional anomaly of monthly temperature in two types of stations. (dashed line: residential stations; solid line: farmland stations;)
The average value 0f three years 02h: 0.84℃; 20h: 0.77℃; 08h: 0.69℃; 14h: 0.33℃; Fig. 3. Regional anomaly of hourly temperature in two types stations (red line:residential stations, black line: farmland stations; a: 2:00, b:8:00, c: 14:00, d: 20:00)
Fig. 4. Comparison of temperature difference between two types of stations in line with typical environment area account for 60%,70%,80% 70%: 26 urban stations, 65 farmland stations 80%: 10 urban stations, 10 farmland stations
Local scale environmental influence (1) Similar surroundings from 5km to 20km Fig. 5. Temperature difference between two groups of stations in line with typical environment changed inside 5km
(2) Different surroundings from 5km to 20km Fig. 6. Temperature difference between two groups of stations in line with typical environment changed beyond 5km
shade projected area influence Farmland stations urban stations Fig. 7. Temperature difference between two shaded area levels of stations in line with typical environment
Summary • 1) The observing environment of 20 km across the observing sites has a noticeable impact on the air temperature observation. The impact can be mostly felt in the winter, night, and the minimum temperature values. • 2) The larger the presence of urban areas in the station’s vicinity, the larger the impact will be on the air temperature observation. • 3) The urban development in the 5km area would compromise air temperature observation by 0.97℃-1.9°C. When natural environment prevails in the 5km area, the urban development beyond the 5km area would have a limited impact on the air temperature observation. • 4) The projected shade may not bring marked errors to the air temperature observations.
Discussions • It is obvious that just restricting the ratio of distance to height of surroundings is not sufficient to guarantee the air temperature’s accuracy and representativeness of a reference station. We suggest that the air temperature observation at a climate reference station shall be made at least 5km away from the urban areas. • For climate change research, one has to pay more attention to the data collected in an affected environment.