Download
1 / 24
240 likes | 262 Views
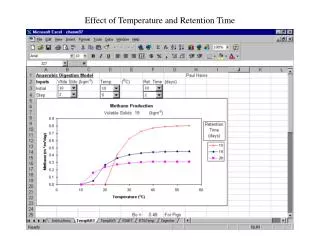
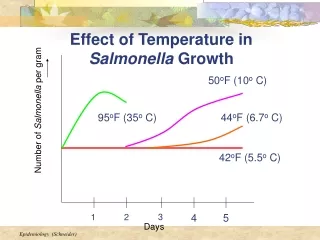
Number of Salmonella per gram. Effect of Temperature in Salmonella Growth. 50 o F (10 o C). 95 o F (35 o C). 44 o F (6.7 o C). 42 o F (5.5 o C). 3. 4. 5. 1. 2. Days. Incubation Periods. Cooked ham, meat, eggs, sauces and gravies. 2-4 hours. Staphylococcus aureus.

E N D
Number of Salmonella per gram Effect of Temperature in Salmonella Growth 50oF (10o C) 95oF (35o C) 44oF (6.7o C) 42oF (5.5o C) 3 4 5 1 2 Days
Incubation Periods Cooked ham, meat, eggs, sauces and gravies 2-4 hours Staphylococcus aureus Clostridium perfringens 12 hours Cooked meats, gravy 12-36 hours Salmonella* Meat, poultry, eggs Clostridium botulinum Canned foods, smoked fish 12-36 hours Vibrio parahemolyticus* Raw fish, shellfish 12 hours Contaminated by carrier, not foodborne 24-48 hours Shigella* * Fever
National Data on Etiology of Foodborne Illness Agent Bacteria (40 agents) 68.7% Salmonella 25.0% Staph. aureus 12.7% Clostridium perfringens 10.0% Clostridium botulinum 9.5% Viral (11 agents) 9.4% Parasites (31 agents) 0.5% Fungal (16 agents) 1.8% Plants (36 agents) - Fish (28 agents) 12.3% Chemicals (28 agents) 7.3%
On April 19, 1940, the local health officer in the village of Lycoming, Oswego County, New York, reported the occurrence of an outbreak of acute gastrointestinal illness to the District Health Officer in Syracuse. Dr. A. M. Rubin, epidemiologist-in-training, was assigned to conduct an investigation. Investigating an Epidemic: Oswego, NY When Dr. Rubin arrived in the field, he learned from the health officer that all persons known to be ill had attended a church supper the previous evening, April 18. Family members who had not attended the church supper had not become ill. Accordingly, the investigation was focused on the circumstances related to the supper.
Interviews regarding the presence of symptoms, including the day and hour of onset, and the food consumed at the church supper, were completed on 75 of the 80 persons known to have been present. A total of 46 persons who had experienced gastrointestinal illness were identified. Q: Is this an Epidemic? Endemic for the region? Due to seasonal variation? Due to random variation?
Select the correct case definition • and find the error in the others: • All participants in the Oswego church supper held in the basement of the church in Lycoming, Oswego County, New York, on April 18, 1940, between 6:00 PM and 11:00 PM; whether they attended church or not; whether they participated in food preparation, transport, or distribution or not; whether they ate or not. • Persons who developed acute gastrointestinal symptoms within 72 hours of eating supper on April 18, 1940, and who were among attendees of the Lycoming, Oswego Church supper. • Church members who developed acute gastrointestinal symptoms within 72 hours of the church supper held in Lycoming, Oswego on April 18, 1940.
Select the correct case definition • and find the error in the others: • All participants in the Oswego church supper held in the basement of the church in Lycoming, Oswego County, New York, on April 18, 1940, between 6:00 PM and 11:00 PM; whether they attended church or not; whether they participated in food preparation, transport, or distribution or not; whether they ate or not. • Persons who developed acute gastrointestinal symptoms within 72 hours of eating supper on April 18, 1940, and who were among attendees of the Lycoming, Oswego Church supper. • Church members who developed acute gastrointestinal symptoms within 72 hours of the church supper held in Lycoming, Oswego on April 18, 1940.
Select the correct case definition • and find the error in the others: • All participants in the Oswego church supper held in the basement of the church in Lycoming, Oswego County, New York, on April 18, 1940, between 6:00 PM and 11:00 PM; whether they attended church or not; whether they participated in food preparation, transport, or distribution or not; whether they ate or not. Missing definition of sickness • Persons who developed acute gastrointestinal symptoms within 72 hours of eating supper on April 18, 1940, and who were among attendees of the Lycoming, Oswego Church supper. CORRECT • Church members who developed acute gastrointestinal symptoms within 72 hours of the church supper held in Lycoming, Oswego on April 18, 1940. Did not specify that they went to the dinner
Incidence of Cases of Diarrhea Among People Attending Lycoming,Oswego Church Supper, June 1940
The supper was held in the basement of the village church. Foods were contributed by numerous members of the congregation. The supper began at 6:00 PM and continued until 11:00 PM. Food was spread out upon a table and consumed over a period of several hours.
Which menu item(s) is the potential culprit? To find out, calculate attack rates. The foods that have the greatest difference in attack rates may be the foods that were responsible for the illness.
Attack Rates by Items Served: Church Supper, Oswego, New York; April 1940 Number of persons who ate specified item Number of persons who did not eat specified item Attack rate (%) Attack rate % Ill Well Ill Well Total Total Baked ham 29 17 46 17 12 29 Spinach 26 17 43 20 12 32 Mashed potato 23 14 37 23 14 37 Cabbage salad 18 10 28 28 19 47 Jello 16 7 23 30 22 52 Rolls 21 16 37 25 13 38 Brown bread 18 9 27 28 20 48 Milk 2 2 4 44 27 71 Coffee 19 12 31 27 17 44 Water 13 11 24 33 18 51 Cakes 27 13 40 19 16 35 Ice cream (van) 43 11 54 3 18 21 Ice cream (choc) 25 22 47 20 7 27 Fruit salad 4 2 6 42 27 69
Attack Rates by Items Served: Church Supper, Oswego, New York; April 1940 Number of persons who ate specified item Number of persons who did not eat specified item Total Attack rate (%) Ill Well Ill Well Total Attack rate % Baked ham 29 17 46 63 17 12 29 59 62 Spinach 26 17 43 60 20 12 32 Mashed potato 23 14 37 62 23 14 37 62 Cabbage salad 18 10 28 64 28 19 47 60 Jello 16 7 23 70 30 22 52 58 Rolls 21 16 37 57 25 13 38 66 Brown bread 18 9 27 67 28 20 48 58 Milk 2 2 4 50 44 27 71 62 Coffee 19 12 31 61 27 17 44 61 Water 13 11 24 54 33 18 51 65 Cakes 27 13 40 67 19 16 35 54 Ice cream (van) 43 11 54 80 3 18 21 14 Ice cream (choc) 25 22 47 53 20 7 27 74 Fruit salad 4 2 6 67 42 27 69 61
Number of persons who ate specified item Attack Rates by Items Served: Church Supper, Oswego, New York; April 1940 Number of persons who did not eat specified item Total Ill Well Ill Well Attack rate (%) Total Attack rate % Baked ham 29 17 46 63 17 12 29 59 Spinach 26 17 43 60 20 12 32 62 Mashed potato 23 14 37 62 23 14 37 62 Cabbage salad 18 10 28 64 28 19 47 60 7 Jello 16 23 70 30 22 52 58 Rolls 21 16 37 57 25 13 38 66 67 Brown bread 18 9 28 20 48 58 27 4 50 Milk 2 2 44 27 71 62 19 Coffee 12 31 61 27 17 44 61 24 Water 13 11 54 33 18 51 65 Cakes 27 13 40 67 19 16 35 54 Ice cream (van) 3 43 11 54 18 21 14 80 25 22 47 53 20 7 27 74 Ice cream (choc) Fruit salad 4 2 6 67 42 27 69 61
Attack Rate by Consumption of Vanilla Ice Cream, Oswego, New York; April 1940 Ill Well Total Attack Rate (%) Ate vanilla ice cream? Yes 43 11 54 79.6 No 3 18 21 14.3 Total 46 29 75 61.3 • The relative risk is calculated as 79.6/14.3 or 5.6 • The relative risk indicates that persons who ate vanilla ice cream were 5.6 times more likely to become ill than those who did not eat vanilla ice cream
Conclusion • An attack of gastroenteritis occurred following a church supper at Lycoming • The cause of the outbreak was most likely contaminated vanilla ice cream
Surveillance Ongoing systematic collection, collation, analysis and interpretation of data; and the dissemination of information to those who need to know in order that action may be taken. World Health Organization
Purposes of Public Health Surveillance • Estimate magnitude of the problem • Determine geographic distribution of illnesses • Portraying the natural history of disease • Detect epidemic / Define a problem • Generate hypotheses and stimulate research • Evaluate control measures • Monitor changes in infectious agents • Detect changes in health practice • Facilitate planning CDC
Passive Surveillance • Physicians, laboratories, and hospitals are given forms to complete and submit with the expectation that they will report all of the cases of reportable disease that come to their attention • Advantages: Inexpensive • Disadvantages: Data are provided by busy health professionals. Thus, the data are more likely to be incomplete and underestimate the presence of disease in the population
Active Surveillance • Involves regular periodic collection of case reports by telephone or personal visits to the reporting individuals to obtain the data • Advantages: More accurate because it is conducted by individuals specifically employed to carry out the responsibility • Disadvantages: Expensive
Sentinel Surveillance • Monitoring of key health events, through sentinel sites, events, providers, vectors/animals • Case report indicates a failure of the health care system or indicates that special problems are emerging • Advantages: Very inexpensive • Disadvantages: Applicable only for a select group of diseases
Some Surveillance Programs • National Notifiable Diseases Surveillance System http://www.cdc.gov/epo/dphsi/nndsshis.htm • Morbidity and Mortality Weekly Report (MMWR) http://www.cdc.gov • Cancer Surveillance, Epidemiology and End Result (SEER) http://www.seer.cancer.gov/
“Good surveillance does not necessarily ensure the making of right decisions, but it reduces the chances of wrong ones.” Alexander D. Langmuir NEJM 1963;268:182-191