General morphometric protocol
This guide outlines a comprehensive protocol in four simple steps for successful morphometric analysis of image and landmark data. It covers data acquisition, shape variation removal, statistical analyses, and graphical presentation of results. Learn essential tips for transferring 3D images to 2D, avoiding common image problems, and digitizing landmarks accurately. Discover how to remove nonshape variation, generate shape variables, and conduct statistical tests to test biological hypotheses effectively. Improve your understanding of morphometric analysis and enhance your research outcomes.

General morphometric protocol
E N D
Presentation Transcript
General morphometric protocol Four simple steps to morphometric success
Four steps Data acquisition – images and landmarks Remove shape variation and generate shape variables – superimposition and TPS Perform statistical analyses to test biological hypotheses – standard multivariate analysis and resampling methods Produce graphical depiction of results – deformation grids, statistical plots, etc.
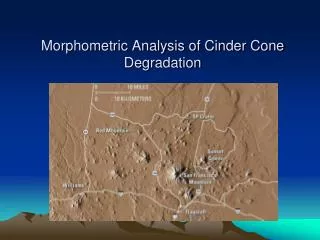
Data acquisition - images Transferring 3D to 2D depiction Many ways to go wrong Three things that don’t matter Location in plane Scale Rotation
Problems to avoid Paralax – pitch and roll “bendiness” – look for straight lines and include points on these lines Articulated structures – can incorporate in analysis or remove as noise, but easiest to avoid problem in beginning
Avoiding image problems Standardize image acquisition procedure Independent quality check
Digitizing landmarks Homology Type 1, 2, and 3 - sliding semilandmarks Order is critical Checking for errors and outliers Symmetrical structures
Step two – remove nonshape variation and generate shape variables 3 types of nonshape variation – relative position, scale, rotation Remove by a process called superimposition via generalized Procrustes analysis or GPA
Scaling Only shape variation left
Generate shape variables Thin plate spline Generates non-affine and affine components referred to as partial warps and uniform components
Shape coordinates • Partial warps come in X and Y pairs, (2p-4) • Uniform components also a pair, X and Y • Combined referred to as the W (weight) matrix • Scores are coordinates of a point along partial warp axes • Nonsingular data matrix for multivariate analysis of shape
Relative warps • Can use PCA on W matrix to generate relative warp scores and use these as data matrix • Useful for visualization of major axis of shape variation