Download
1 / 24
430 likes | 999 Views
Soil Water Tension. Department of Agricultural and Biological Engineering. University of Illinois at Urbana-Champaign. +h. -h. Soil Water Characteristic (Release Curve). Matric Potential. Tensiometer for Measuring Soil Water Potential. Water Reservoir.

E N D
Soil Water Tension Department of Agricultural and Biological Engineering University of Illinois at Urbana-Champaign
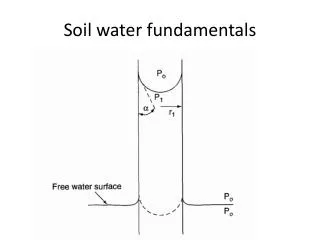
Soil Water Characteristic (Release Curve) Matric Potential
Tensiometer for Measuring Soil Water Potential Water Reservoir Variable Tube Length (12 in- 48 in) Based on Root Zone Depth Vacuum Gauge Porous Ceramic Tip
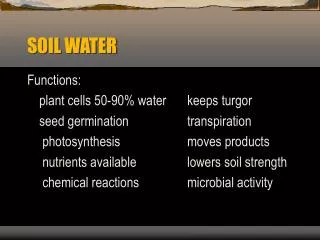
Soil Water Potential • Measure of the energy status of the soil water • Important because it reflects how hard plants must work to extract water • Units of measure are normally bars or atmospheres • Soil water potentials are negative pressures (tension or suction) • Water flows from a higher (less negative) potential to a lower (more negative) potential
Soil Water Potential • Components • t = total soil water potential • g = gravitational potential (force of gravity pulling on the water) • m = matric potential (force placed on the water by the soil matrix – soil water “tension”) • o = osmotic potential (due to the difference in salt concentration across a semi-permeable membrane, such as a plant root) • Matric potential, m, normally has the greatest effect on release of water from soil to plants
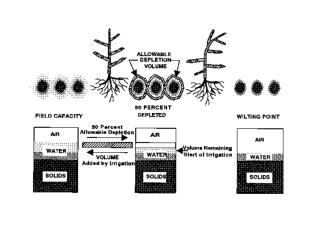
Hydroscopic Water Gravitational Water Capillary Water Water adheres to soil particles Water held in large pores Available for crop use Water drains through soil profile Wilting Point 15 bars Field Capacity 1/3 bar
Water Movement in Plants • Illustration of the energy differentials which drive the water movement from the soil, into the roots, up the stalk, into the leaves and out into the atmosphere. • The water moves from a less negative soil moisture tension to a more negative tension in the atmosphere.
Yw~ -1.3 MPa Leaf air spaces Yw~ -1.0 MPa Xylem Yw~ -0.8 MPa Yw~ -0.75 MPa Yw~ -0.15 MPa Ys~ -0.025 MPa
Effect of Soil Texture Fine Textured Soil Water Content Coarse Textured Soil Matric Potential
Matric Potential and Soil Texture The tension or suction created by small capillary tubes (small soil pores) is greater that that created by large tubes (large soil pores). At any given matric potential coarse soils hold less water than fine-textured soils. Height of capillary rise inversely related to tube diameter
Effect of Soil Structure Aggregated Soil Water Content Compacted Soil Matric Potential
q = qr + (qs - qr) [1 + (a h)n]m Van Genuchten Representation a = empirical parameter h = soil water pressure head n = empirical parameter that affects the shape of the curve m = empirical parameter that affects the shape of the curve (m = 1 - 1/n) qr = residual water content (an extrapolated parameter) qs = saturated water content q = volumetric water content at head, h.
Brooks and Corey Representation q = qr + (qs - qr) (hd/h)l l = empirical parameter hd = soil water pressure head qr = residual water content (an extrapolated parameter) qs = saturated water content q = volumetric water content at head, h.
A moist sand sample has a volume of 456 cm3 in the natural state and a weight of 843 g. The dry weight is 763 g and the specific gravity of the soil particles is 2.65. Determine the porosity, volumetric moisture content, and degree of saturation (water filled porosity/total porosity)
A soil sample with a volume V=100 cm3 was placed in a pressure plate apparatus and brought to apparent saturation. The following outflow volumes were measured at equilibrium for the given pressure settings. After equilibrium was obtained at the 500 cm pressure, the sample was found to have a dry bulk density of 1.64 g/cm3, and a gravimetric water content (mass of water/mass of solids) of 0.031. Evaluate and plot the soil water retention curve from these data
Determine the volume (depth) of water that is released from Tama Silt Loam when the water table falls from the soil surface to 1 m below the soil surface.
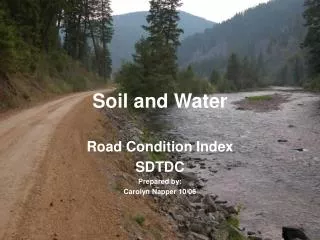
Drummer Silty Clay Loam This poorly drained "prairie soil" formed in 40 to 60 inches of loess over Wisconsinan drift. It occupies nearly 1.6 million acres. It has a high management level productivity index (PI) of 150.