Download
1 / 23
230 likes | 409 Views
Hamilton County Power Up YOUth Survey. October 15, 2008 Drs. Mark Grey and Michele Devlin University of Northern Iowa. School. Frequency. Percent. Northeast Hamilton. 25. 16.6. South Hamilton. 3. 2.0. Webster City. 123. 81.5. Total. 151. 100.0.

E N D
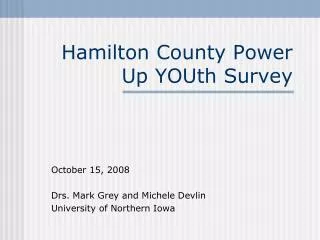
Hamilton County Power Up YOUth Survey October 15, 2008 Drs. Mark Grey and Michele Devlin University of Northern Iowa
School Frequency Percent Northeast Hamilton 25 16.6 South Hamilton 3 2.0 Webster City 123 81.5 Total 151 100.0 Hamilton County Power Up YOUth SurveyEvaluation Report: Baseline Data2008 Total Surveys Returned: 151
Grade Frequency Percent 8 43 28.5 10 68 45.0 12 39 25.8 Total 150 99.3 Missing 1 .7 Total 151 100.0 Grade
Gender Frequency Percent F 81 53.6 M 56 37.1 NA 14 9.3 Total 151 100.0 Sex/Gender
Age First Drank More than a Few Sips of Alcohol (8th Graders) Baseline 2008 Percent 2005 IYS Never 28 68% 64% 8 or Younger 3 7% 3% 9 or 10 2 5% 6% 11 or 12 1 2% 14% 13 or 14 7 17% 13% 15 or 16 0 0% 0% 17 or older 0 0% 0% % who answered question 41 95% 100%
Age First Drank More than a Few Sips of Alcohol (10th Graders) Frequency Percent Never 26 38.2 Age 14 14 20.6 15 12 17.6 16 6 8.8 13 6 8.8 12 2 2.9 17 1 1.5 6 1 1.5 Total 68 100.0
Age First Drank More than a Few Sips of Alcohol (12th Graders) Frequency Percent Age 17 9 23.1 14 8 20.5 Never 8 20.5 16 4 10.3 15 4 10.3 8 2 5.1 13 2 5.1 3 1 2.6 11 1 2.6 Total 39 100.0
Age Tried Marijuana for First Time Age Never 11 13 14 15 16 17 NA Total Grade 8 41 1 1 43 10 53 2 1 3 7 2 0 68 12 30 1 1 1 5 1 0 39 Total 124 3 2 4 8 7 1 1 150
Age Tried Marijuana for First Time (All Grades) 2008 Baseline Percent 2005 IYS Never 124 83% 85% 8 or Younger 0 0% 1% 9 or 10 0 0% 1% 11 or 12 3 2% 2% 13 or 14 6 4% 3% 15 or 16 15 10% 1% 17 or older 1 1% 0% % who answered question 99% 99%
Age Smoked Whole Cigarette for First Time (All Grades) 2008 Baseline Percent 2005 IYS Never 105 70% 79% 8 or Younger 3 2% 3% 9 or 10 3 2% 3% 11 or 12 6 4% 4% 13 or 14 12 8% 6% 15 or 16 15 10% 6% 17 or older 7 5% 0% % who answered question 100% 99%
Frequency of Use in Past 30 Days (all grades) At Least One Drink in Past 30 Days No = 74.8 Used Marijuana in Past 30 Days No = 96.7% Used Tobacco in Past 30 Days No = 81.5%
Feel at Risk Drinking Alcohol Yes Percent No Percent NA Total Grade 8 28 19% 10 7% 5 43 10 39 26% 28 19% 1 68 12 15 10% 24 16% 0 39 Total 82 55% 62 41% 6 150 Perceptions of Risk or Harm
Perceptions of Risk or Harm Feels there are risk associated with marijuana and has or has not smoked marijuana (all grades)
Have You Attended a Party Where Alcohol Was Available to You?