Delays, Layered network model and NETWORK Security
270 likes | 482 Views
Delays, Layered network model and NETWORK Security . How do loss and delay occur?. packets queue in router buffers packet arrival rate to link (temporarily) exceeds output link capacity packets queue, wait for turn. packet being transmitted (delay). packets queueing (delay).

Delays, Layered network model and NETWORK Security
E N D
Presentation Transcript
How do loss and delay occur? packets queue in router buffers packet arrival rate to link (temporarily) exceeds output link capacity packets queue, wait for turn packet being transmitted (delay) packets queueing(delay) free (available) buffers: arriving packets dropped (loss) if no free buffers A B Introduction
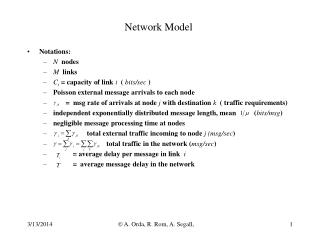
Four sources of packet delay dproc: nodal processing check bit errors determine output link typically < msec transmission A propagation B nodal processing queueing dnodal = dproc + dqueue + dtrans + dprop dqueue: queueing delay • time waiting at output link for transmission • depends on congestion level of router Introduction
dtrans and dprop very different Four sources of packet delay transmission A propagation B nodal processing queueing dnodal = dproc + dqueue + dtrans + dprop dprop: propagation delay: • d: length of physical link • s: propagation speed in medium (~2x10⁸ m/sec) • dprop = d/s dtrans: transmission delay: • L: packet length (bits) • R: link bandwidth (bps) • dtrans= L/R Introduction * Check out the Java applet for an interactive animation on trans vs. prop delay
Caravan analogy cars “propagate” at 100 km/hr toll booth takes 12 sec to service car (bit transmission time) car~bit; caravan ~ packet Q: How long until caravan is lined up before 2nd toll booth? time to “push” entire caravan through toll booth onto highway = 12*10 = 120 sec time for last car to propagate from 1st to 2nd toll both: 100km/(100km/hr)= 1 hr A: 62 minutes 100 km 100 km ten-car caravan toll booth toll booth Introduction
Caravan analogy (more) suppose cars now “propagate” at 1000 km/hr and suppose toll booth now takes one min to service a car Q: Will cars arrive to 2nd booth before all cars serviced at first booth? A: Yes! after 7 min, 1st car arrives at second booth; three cars still at 1st booth. 100 km 100 km ten-car caravan toll booth toll booth Introduction
R: link bandwidth (bps) L: packet length (bits) a: average packet arrival rate Queueing delay (revisited) average queueing delay traffic intensity = La/R • La/R ~ 0: avg. queueing delay small • La/R -> 1: avg. queueing delay large • La/R > 1: more “work” arriving than can be serviced, average delay infinite! La/R ~ 0 La/R -> 1 * Check out the Java applet for an interactive animation on queuing and loss Introduction
“Real” Internet delays and routes what do “real” Internet delay & loss look like? traceroute program: provides delay measurement from source to router along end-end Internet path towards destination. For all i: sends three packets that will reach router i on path towards destination router i will return packets to sender sender times interval between transmission and reply. 3 probes 3 probes 3 probes Introduction
“Real” Internet delays, routes traceroute: gaia.cs.umass.edu to www.eurecom.fr 3 delay measurements from gaia.cs.umass.edu to cs-gw.cs.umass.edu 1 cs-gw (128.119.240.254) 1 ms 1 ms 2 ms 2 border1-rt-fa5-1-0.gw.umass.edu (128.119.3.145) 1 ms 1 ms 2 ms 3 cht-vbns.gw.umass.edu (128.119.3.130) 6 ms 5 ms 5 ms 4 jn1-at1-0-0-19.wor.vbns.net (204.147.132.129) 16 ms 11 ms 13 ms 5 jn1-so7-0-0-0.wae.vbns.net (204.147.136.136) 21 ms 18 ms 18 ms 6 abilene-vbns.abilene.ucaid.edu (198.32.11.9) 22 ms 18 ms 22 ms 7 nycm-wash.abilene.ucaid.edu (198.32.8.46) 22 ms 22 ms 22 ms 8 62.40.103.253 (62.40.103.253) 104 ms 109 ms 106 ms 9 de2-1.de1.de.geant.net (62.40.96.129) 109 ms 102 ms 104 ms 10 de.fr1.fr.geant.net (62.40.96.50) 113 ms 121 ms 114 ms 11 renater-gw.fr1.fr.geant.net (62.40.103.54) 112 ms 114 ms 112 ms 12 nio-n2.cssi.renater.fr (193.51.206.13) 111 ms 114 ms 116 ms 13 nice.cssi.renater.fr (195.220.98.102) 123 ms 125 ms 124 ms 14 r3t2-nice.cssi.renater.fr (195.220.98.110) 126 ms 126 ms 124 ms 15 eurecom-valbonne.r3t2.ft.net (193.48.50.54) 135 ms 128 ms 133 ms 16 194.214.211.25 (194.214.211.25) 126 ms 128 ms 126 ms 17 * * * 18 * * * 19 fantasia.eurecom.fr (193.55.113.142) 132 ms 128 ms 136ms trans-oceanic link * means no response (probe lost, router not replying) * Do some traceroutes from exotic countries at www.traceroute.org Introduction
Packet loss queue (aka buffer) preceding link in buffer has finite capacity packet arriving to full queue dropped (aka lost) lost packet may be retransmitted by previous node, by source end system, or not at all buffer (waiting area) packet being transmitted A B packet arriving to full buffer is lost Introduction
Throughput throughput: rate (bits/time unit) at which bits transferred between sender/receiver instantaneous: rate at given point in time average: rate over longer period of time pipe that can carry fluid at rate Rsbits/sec) pipe that can carry fluid at rate Rcbits/sec) server sends bits (fluid) into pipe link capacity Rsbits/sec server, with file of F bits to send to client link capacity Rcbits/sec Introduction
Throughput (more) Rs < RcWhat is average end-end throughput? Rsbits/sec Rcbits/sec Rcbits/sec bottleneck link link on end-end path that constrains end-end throughput Rsbits/sec • Rs > RcWhat is average end-end throughput? Introduction
Throughput: Internet scenario per-connection end-end throughput: min(Rc,Rs,R/10) in practice: Rc or Rs is often bottleneck Rs Rs Rs R Rc Rc Rc 10 connections (fairly) share backbone bottleneck link Rbits/sec Introduction
Protocol “Layers” Networks are complex! • many “pieces”: • hosts • routers • links of various media • applications • protocols • hardware, software Question: Is there any hope of organizing structure of network? Or at least our discussion of networks? Introduction
ticket (complain) baggage (claim) gates (unload) runway landing airplane routing ticket (purchase) baggage (check) gates (load) runway takeoff airplane routing airplane routing Organization of air travel • a series of steps Introduction
ticket ticket (purchase) baggage (check) gates (load) runway (takeoff) airplane routing ticket (complain) baggage (claim gates (unload) runway (land) airplane routing baggage gate airplane routing airplane routing takeoff/landing airplane routing departure airport intermediate air-traffic control centers arrival airport Layering of airline functionality Layers: each layer implements a service • via its own internal-layer actions • relying on services provided by layer below Introduction
Why layering? Dealing with complex systems: • explicit structure allows identification, relationship of complex system’s pieces • layered reference model for discussion • modularization eases maintenance, updating of system • change of implementation of layer’s service transparent to rest of system • e.g., change in gate procedure doesn’t affect rest of system • layering considered harmful? Introduction
application transport network link physical Internet protocol stack • application: supporting network applications • FTP, SMTP, HTTP • transport: process-process data transfer • TCP, UDP • network: routing of datagrams from source to destination • IP, routing protocols • link: data transfer between neighboring network elements • PPP, Ethernet • physical: bits “on the wire” Introduction
Application Presentation Session Transport Network Data link Physical ISO/OSI reference model • presentation: allow applications to interpret meaning of data, e.g., encryption, compression, machine-specific conventions • session: synchronization, checkpointing, recovery of data exchange • Internet stack “missing” these layers! • these services, if needed, must be implemented in application • needed? Introduction
network link physical link physical M M M Ht M Hn Hn Hn Hn Ht Ht Ht Ht M M M M Ht Hn Ht Hl Hl Hl Hn Hn Hn Ht Ht Ht M M M source Encapsulation message application transport network link physical segment datagram frame switch destination application transport network link physical router Introduction
Network Security • The field of network security is about: • how bad guys can attack computer networks • how we can defend networks against attacks • how to design architectures that are immune to attacks • Internet not originally designed with (much) security in mind • original vision:“a group of mutually trusting users attached to a transparent network” • Internet protocol designers playing “catch-up” • Security considerations in all layers! Introduction
Bad guys can put malware into hosts via Internet • Malware can get in host from a virus, worm, or trojan horse. • Spyware malware can record keystrokes, web sites visited, upload info to collection site. • Infected host can be enrolled in a botnet, used for spam and DDoS attacks. • Malware is often self-replicating: from an infected host, seeks entry into other hosts Introduction
Bad guys can put malware into hosts via Internet • Worm: • The worm is code that replicate itself in order to consume resources to bring it down. • infection by passively receiving object that gets itself executed • self- replicating: propagates to other hosts, users • Trojan horse • Hidden part of some otherwise useful software • Today often on a Web page (Active-X, plugin) • Virus • The virus is the program code that attaches itself to application program and when application program run. • infection by receiving object (e.g., e-mail attachment), actively executing • self-replicating: propagate itself to other hosts, users Sapphire Worm: aggregate scans/sec in first 5 minutes of outbreak (CAIDA, UWisc data) Introduction
target Bad guys can attack servers and network infrastructure • Denial of service (DoS): attackers make resources (server, bandwidth) unavailable to legitimate traffic by overwhelming resource with bogus traffic select target break into hosts around the network (see botnet) send packets toward target from compromised hosts Introduction
src:B dest:A payload The bad guys can sniff packets Packet sniffing: • broadcast media (shared Ethernet, wireless) • promiscuous network interface reads/records all packets (e.g., including passwords!) passing by C A B • Wireshark software is a (free) packet-sniffer Introduction
src:B dest:A payload The bad guys can use false source addresses • IP spoofing: send packet with false source address C A B Introduction
The bad guys can record and playback • record-and-playback: sniff sensitive info (e.g., password), and use later • password holder is that user from system point of view C A src:B dest:A user: B; password: foo B Introduction