ALMA Observing Tool hands on session
610 likes | 630 Views
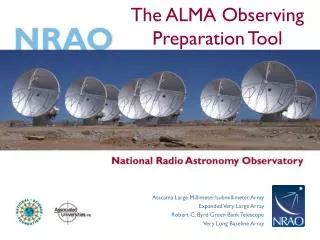
How to turn that great idea into an ALMA proposal. ALMA Observing Tool hands on session. Veronica Allen Author: Harvey Liszt. Atacama Large Millimeter/ submillimeter Array Expanded Very Large Array Very Long Baseline Array.

ALMA Observing Tool hands on session
E N D
Presentation Transcript
How to turn that great idea into an ALMA proposal... ALMA Observing Tool hands on session Veronica Allen Author: Harvey Liszt Atacama Large Millimeter/submillimeter Array Expanded Very Large Array Very Long Baseline Array
ALMA Cycle 7 Planninghttps://almascience.nrao.edu/news/alma-cycle-7-pre-announcement • Dates to remember in 2019
A clean slate. From here, you can: • Start a new proposal • Add blank Science Goals (SG) • Load templates with example SG Grab and move stipled bars up/down to resize arrowheads minimize, maximize panes
You can right-click and add blank Science Goals or use options of the File menu as shown on the next slide)
This science goal in the template can be copied whole into new Planned Observing or a sub-node could be copied into a science goal
You’re now ready to flesh out the Science Goal (SG) Give the SG a brief, descriptive name. A description is useful for you, for the technical assessors, and for your Contact Scientist after your project is approved. But it’s optional
The field setup node is where you provide source coordinates and other basic properties for one or more field sources/pointings
All sources having a common spectral setup and observing pattern (single pointings or rectangular mosaic) should be put in the same Science Goal no matter how far apart they are
Two practice scenarios Milky Way: Line detection for chemical characterization in Orion KL Background: The chemical composition of gas surrounding young stars gives some indication of physical conditions. Additionally, the deuterium fraction of a system can be used to determine the age of that system. We will use ALMA to detect multiple lines of CH3CN and CH3OH to determine the properties of this region and better understand star formation. Extragalactic: Continuum and CO mapping of NGC 4797 Background: Minor mergers are an important process in galaxy evolution. Whilst major mergers often enhance star formation, minor mergers have been shown to suppress star-formation (Davis et al. 2015). We will use ALMA to determine the underlying physical cause of this intriguing effect.
Scenario 1: ISM & Astrochemistry • Science goal: determine the chemical composition and deuterium fraction of star-forming region Orion KL. • Method: high-resolution mapping of the area to trace variations in composition and D/H for CH3CN and CH3OH
Field Setup • Orion KL is a common object, so press Resolve to input the coordinates. Always check that these are accurate for your object. • Display your source and the field of view using Image Query • For Orion KL, 2MASS works well • Continuum flux density estimated from SED or existing continuum observations • Line flux for the weakest line you aim to detect – spectral modeling helps in estimating this
Spectral setup • Our main science goal involves detecting multiple transitions of CH3CN, CH2DCN, CH3OH, and CH2DOH so the spectral windows are set accordingly. • Use “Select Lines to Overlay” to set spectral windows covering multiple lines. • There are 2 basebands per side band but you can subdivide them into as many as 4 spectral windows each Sidebands
Dividing basebands • The single spectral window used for CH3OH does not cover the higher energy lines so we need another smaller spectral window • Add a spectral window centered on the CH3OH v=1 transition at 289.399655 GHz • Select a correlator mode to match the others and ensure that the other spectral window in this baseband is ½ • How wide are the spectral windows now?
Control and Performance • Setting the desired angular resolution and largest angular structure automatically decides the needed configurations • Desired sensitivity should give you at least a 3-sigma detection of the line flux density in Field setup • Our setup includes a full array and an ACA configuration • An ACA configuration adds ~4x the 12m-array time
Don’t be greedy • If you ask for high spatial resolution, crazy sensitivity, and multiple configurations, yourobservation will last hundreds of years…
Validate & submit Click here to make sure that your project can be validated by the OT. If it doesn’t validate the archive will reject it.
Clicking on a validation error usually takes you to the problem directly
Scenario 2: Extragalactic Two separate Science cases Science case 1: Gas • Science goal: Study the gas velocity and distribution in a minor merger remnant (NGC 4797), to distinguish between dynamical suppression, gravitational heating and AGN/starburst feedback (van de Voort et al. 2018). • Method: Spectral line observation of CO (1-0) at 10 km/s resolution. The CO gas traces molecular hydrogen gas and will be used to map the gas velocity and distribution.
Science Case 1 Continuum • Set the peak continuum flux sensitivity per synthesized beam to 0.304mJy/beam in the field setup (this was estimated from fitting a modified blackbody to fluxes at shorter wavelengths). • Now add 3 spectral windows to record continuum in band 3. Use the lowest spectral resolution correlator mode, and use the full 7.5 GHz bandwidth. • What is the continuum flux density S/N? (Hint - use the Technical Justification tab). • Change the largest angular structure to 20". What is the integration time now, and why is it longer?
NGC 4797 Science case 2 Science case 2: dust continuum • Science goal: Map the dust continuum to look for extended dust emission, and to do radiative transfer modelling to reveal the sources of dust heating. • Method: Image the dust continuum at high resolution to match the spatial resolution of existing optical data. The dust continuum will be brightest at high frequency (Band 9).
Setup second Science case • Copy the science goal and give it a new name. • Change the spectral setup to observe continuum in band 9. Note the mirror images of the spectral windows. • Set the peak continuum flux to 0.89 mJy/beam and the peak line flux to zero. • Set the desired angular resolution to 0.6" and the largest angular scale to 2.0". • What is the desired sensitivity needed to reach a S/N of 5 for the continuum? (Hint, the integration time is 8.8 hours).
Mosaic • We want to make a map of the dust a larger region than one pointing. • In field setup, change to a rectangular field and make a 7"x7" mosaic. Use Nyquist spacing (the default) between the pointings. This is the spacing of samples on the sky needed to get good imaging of large-scale low surface brightness emission. Use the spatial image tool to help you visualize the pointing positions. • How long is the integration time now?
Don’t be afraid to ask for directions Suggestion: input file formats are shown in the help sections that you invoke with the local ?
A Few OT Tips… • The same cut and paste commands you use outside the OT for text also work inside it since Cycle 5 • Ctrl-Z global shortcut will expand out all succeeding items in the J-tree (try it, you’ll see what we mean) • Holding down ALT when making choices in dropdown lists will convert to the unit or type of the new choice • Otherwise, only the description changes, not value • OT does galactic-celestial conversion automatically • Cannot convert in other ways, eg not FK5 J2000 to ICRS. FK5 J2000 now deprecated
A Few More OT Tips… • NEW In the J-tree: Holding down the alt key in combination with the up/down arrows will move from a node in one SG to the same node in the adjacent SG (try it when you have more than one SG)
www.almascience.org ALMA Science Portal @ NRAO
ALMA • Have no fear, the ALMA Helpdesk is here… I could use a hand…
Crafting mosaics The Spatial tab gives a graphical visualization of the Field Setup. when you click on this node you will now land on its visualizer tab Select a background image from an online image server
Crafting mosaics Setting up the mosaic in the Field Setup Define the length, width and position angle of the region to mosaic. Default is to separate the field centers by about 48% of the primary beam (the Nyquist rate). HPBW for the 12m antennas are 1.13l/D Estimated number of 7m Array pointings No more than 150 12m Array pointings.
Crafting mosaics You can load a local fits image ICRS You can turn on/off the mosaic beam pattern
The spectral setup tab when you click on this node you will land on its visualizer tab Overlaid lines are saved with the project see below
Scrolled down from previous slide ADD spectral windows to get started! This option will call up the spectral line picker. Spectral windows added this way retain line id and other info from the Splatalogue Frequencies may also be entered by hand
The spectral line picker has new filters Select one or more lines from a splatalogue-based list you can filter using the tools at left (see below)
This previously used a slider Filter by receiver band / frequency The line lists can be long, so use filters Filter by name New! The Receiver/Back End Configuration Filters have been revised. Potentially selectable = in either sideband
Sky frequency is shown in barycentric frame so rest and sky frequency differ even when Vlsrk=0 New Cycle 7! The OT should give validation warnings if a) any part of a spw is closer than 30 MHz to the baseband edge or b) more than half of the spw is within (30 MHz + the line width) of the baseband edge. Default spectral binning is 2 but can be set to other values with justification Note! Once a spectral window is defined with a rest frequency within it, the window must always thereafter contain that rest frequency or the OT will complain!
Double click this field to select bandwidth & resolution from a dropdown list
Failing to rename a new spw brings a validation error • Spectral specs share a base- band so the sum of shares can’t exceed 1. Choices for resolution change with this fraction
Full Continuum & Polarization Full Polarization for Bands 3 – 7 You can edit frequencies used for continuum polarization. If FULL is specified, expected polarization percentages must be given with the field setup tab • Standard single continuum setups, can be modified with justification
Full Continuum & Polarization Full Polarization for Bands 3 - 7 User can edit frequencies used for continuum polarization. If FULL is specified, an expected polarization percentage must be given with the field setup tab • Standard single continuum setups, can be modified with justification Suggestion: Polarization Schedule blocks are 3+ hours long to get parallactic angle coverage and the rms noise may be much less than specified on the ctrl&perf page TECHNICAL JUSTIFICATION shows the actual expected rms noise and various S/N ratios
Automated spectral scan - I New Cycle 7: Spectral scan observing has been made more efficient by joining all calibrator tunings to lessen the number of antenna pointing calibrations Automated Spectral Scan mode and tunings
Automated spectral scan - II Visual Representation of the Spectral Scan Mode – Actual spectral coverage vs. requested coverage
Bands 9&10 - sideband separation (90o Walsh) Only 1.875 GHz bandwidth, line or continuum allowed Bands 9,10 have double sideband receivers but the sidebands can be separated using an additional phase-switching step, 90o Walsh switching. This can be turned on solely to reject lines in the image sideband, but once enabled, the two SB may be stored separately. Note that the noise is not affected because only a correlated signal can be separated. See where lines in one SB appear in the other if checked New in Cycle 7! ON by default Record both SB? Only 1.875 GHz bandwidth, line or continuum allowed