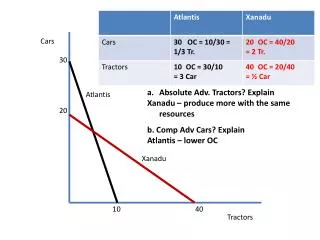
The Atlantis Ecosystem Modeling Framework
The Atlantis Ecosystem Modeling Framework. Isaac Kaplan, Chris Harvey, Phil Levin, Jason Link, Howard Townsend NOAA NMFS Beth Fulton CSIRO Australia. Ecosystem models can improve our understanding of interactions between species, climate, fishing, and habitat.

The Atlantis Ecosystem Modeling Framework
E N D
Presentation Transcript
The Atlantis Ecosystem Modeling Framework Isaac Kaplan, Chris Harvey, Phil Levin, Jason Link, Howard Townsend NOAA NMFS Beth Fulton CSIRO Australia
Ecosystem models can improve our understanding of interactions between species, climate, fishing, and habitat. The Atlantis ecosystem model (Fulton et al. 2004) is a strategic tool used to:1. synthesize this information; 2. simulate possible ecosystem responses;3. identify key processes that govern ecosystem condition
Management submodel Assessment and policy decisions Fisheries submodel a b c g f e d c b a d 0 m e f 50 g 100 Community submodel 150 200 Habitat 550 1200 2400 3-dimensional structure of model Daily oceanographic fluxes (water, heat, salt) into and out of each box are controlled by a ROMS oceanographic model Biogeochemistry Hydrographic submodel Climate and oceanography
Atlantis Models Fully Developed • SE Australia • Port Phillip Bay, Aus. Mostly Completed Westernport, Australia • Northeast US • California Current Early Stages • Torres Strait • Coastal NSW • Clarence River NSW • SW Australia • Ningaloo Marine Park • SE Tasmania • Central California
S.E. Australia Cal. Current Beth Tasmania N.E. U.S. Santa Cruz Long Island
What are the key features/equations/functions/ assumptions of the model?
Primary producers Light Detritus Nutrients Disease, Lysis, Stress, Fouling Primary producer Space Grazer A Grazer B Grazer C
Invertebrate consumers Nutrients Detritus Food availability Disease, Oxygen limitation Prey A Invertebrate Prey B Prey C Predator A Predator B Predator C
Vertebrate consumers (age-structured) Nutrients Detritus Prey availability Disease, Oxygen limitation Gape limitation Vertebratei Reserve ║ Structure Predator A Prey A Predator B Prey B Predator C Prey C Reproduction
Vertebrate predation and reproduction Holling type II Beverton Holt Prey Consumption per Predator Recruits Prey abundance Adults OR Ricker, condition-dependent Beverton Holt, constant, lognormal, dependent on prim producers (Chla), dependent on all plankton, Bev-Holt with lognormal variation added, Bev-Holt with prescribed recovery, linearly dependent on maternal condition, pupping/calving a fixed number per adult spawning, or forced timeseries of recruitment OR Holling type I, Holling type III, Ecosim, Size specific Holling type III, min-max
Spatially Explicit Output Washington Oregon Small flatfish (Pleuronectids: Dover sole, rex sole, sanddab) (mg N/m3) Cape Mendocino Santa Cruz Santa Barbara Year 1 Year 40
Atlantis biological parameters • For each species • Abundance per area • Individual growth rates, length-weight conversions • Max age, and age-at-maturity • General habitat preferences • Dispersal and/or migratory characteristics, within and outside model • Diets • Recruitment parameters (e.g. Beverton Holt, Ricker) • For ecosystem map • Habitat distribution (bottom type + biogenic habitat) • For calibration • Historical catch and abundance data
What key data gaps have been identified? Are these data gaps informing monitoring efforts? • Biomass estimates: nearshore and pelagic species, lower trophic levels (jellyfish, benthos, etc.) • Diets • Bycatch rates • Fleet costs (US) and social factors governing fleet behavior
Monitoring and Indicators Observations Observations Ecology and 1 yr cycle Assessments and Assessments and Fishing 1 year 1 year cycle Parameter Parameter cycle Simulator (Atlantis) Estimation Estimation Management policies: quotas, effort limits, MPAs Implementation Management Strategy Evaluation
S.E. Australia-Fleet Restructuring • Ecosystem-scale MSE • Pros and cons of 5 kinds of management strategies • Results = balanced use of levers is most effective • Led to refinement of questions (incentive systems, size of spatial management zones etc) • S.E. Australia- Indicators • MSE tested hundreds proposed indicators (with fisheries dependent and independent "data") • Results=need a suite, cover range of species with different characteristics • Will shape reporting and decision rules (in tiered harvest strategies) Central California – Considering interactions between state and Sanctuary management
Atlantis Cons • Build time (6 months) • Run time (hours- days) • Lacks balancing routines • Cumbersome parameterization Pros • Flexible options for predation, reproduction, growth, gape limitation • MSE (monitoring, assessments, indicators, economics, management) • Nutrient handling, and interfaces with ROMS oceanography output • Migrations out of region
Model development and improvement • Output graphics code for total biomass time series, biomass per region, and weight-at-age • Diet handling • Improved user interface and parameter input Weight-at-age
Funding • NOAA NMFS • NOAA Fisheries and the Environment (FATE) • NOAA NMFS Economics Program • Moore Foundation • Packard Foundation Contacts Beth Fulton Beth.Fulton@csiro.au Isaac Kaplan Isaac.Kaplan@noaa.gov Jason Link Jason.Link@noaa.gov
Weight-at-age Weight-at-age relative to expectation from von Bertalanffy Age class 1 Age class 10
Atlantis publications are peer reviewed Journal Articles • Fulton, E. A. 2004. Biogeochemical marine ecosystem models II: the effect of physiological detail on model performance. Ecological Modelling 173:371-406. • Fulton, E. A., and A. D. M. Smith. 2004. Lessons learnt from a comparison of three ecosystem models for Port Phillip Bay, Australia. South African Journal of Marine Science 26:219-243. • Fulton, E. A., A. D. M. Smith, and C. R. Johnson. 2003a. Effect of complexity on marine ecosystem models. Marine Ecology Progress Series 253:1-16. • Fulton, E. A., A. D. M. Smith, and C. R. Johnson. 2003b. Mortality and predation in ecosystem models: is it important how these are expressed? Ecological Modelling 169:157-178. • Fulton, E. A., A. D. M. Smith, and C. R. Johnson. 2004. Effects of spatial resolution on the performance and interpretation of marine ecosystem models. Ecological Modelling 176:27-42. • Fulton, E. A., Smith, A. D. M., and Punt, A. E. 2005. Which ecological indicators can robustly detect effects of fishing? ICES Journal of Marine Science, 62: 540-551. Technical Documents • Brand, E. J., I. C. Kaplan, C. J. Harvey, E. A. Fulton, A. J. Hermann, J. C. Field and P.S. Levin. In press. A Spatially Explicit Ecosystem Model of the California Current’s Food Web and Oceanography. NOAA Tech Memo. NMFS-NWFSC. • Fulton, E.A., Fuller, M., Smith, A.D.M. and Punt, A., 2005. Ecological Indicators of the Ecosystem Effects of Fishing: Final Report. Australian Fisheries Management Authority Report, R99/1546. • Fulton, E.A., Slater J., Smith, A.D.M. and Webb, H., 2005. Ecological Indicators for the Impacts of Fishing on Non-Target Species, Communities and Ecosystems: Review of Potential Indicators. Australian Fisheries Management Authority Report, R99/1546-A. • Fulton, E. A., Smith, A. D. M., and Punt, A. E. 2003. Indicators of the Ecosystem Effects of Fishing: Case-Study 1 – Temperate Bay Ecosystem. Milestone Project Report, CSIRO Marine Research, Hobart. The code base is not (but is the product of 10+ years of work by many at CSIRO)
Fisheries: age-specific catch Carrion Effort Catch Fleet A Availability Fleet B Fish, age i Catchability Fleet C Selectivity
Key elements for each presentation: What is/has/will the model be used for? What are the data requirements? What key data gaps have been identified? Are these data gaps informing monitoring efforts? What are the key features/equations/functions/assumptions of the model?What are the strengths of this model? What are the weaknesses of this model? Has the model been published in the peer reviewed literature? Has the model & software been through a formal peer review? Have the model outputs been through a formal peer review?How portable is the model software package? What remains for model development/improvement/enhancement? Has/is/will the model outputs be used in LMR management?
Model food web has 56 functional groups, including: • 3 primary producer groups • 2 bacteria groups • 3 infaunal invertebrate groups • 9 epifaunal invertebrate groups • 5 pelagic invertebrate groups • 21 fish groups • 3 seabird groups • 6 marine mammal groups • 2 detritus pools
California Current Ecosim model Field (2004, 2006)
Fisheries To date: PacFIN catch per region, 1981-2004 Future work: Fleet dynamics calibrated to historical catches, and limited by spatial or seasonal closures, quotas or effort limits Groundfish trawling effort off central Oregon Coast, 2003
Outputs with No Fishing Cape Flattery Columbia River Cape Blanco Cape Mendocino Monterey Bay Point Conception Chloro- phyll a (mg N/m3) Year 40 Year 1
Outputs with No Fishing Deep corals and anemones (mg N/m3) Year 1 Year 40
Outputs with No Fishing Small flatfish (Pleuronectids: Dover sole, rex sole, sanddab) (mg N/m3) Year 1 Year 40
Scoping Identify goals of EBM and threats to achieving goals Develop ecosystem indicators and targets Risk Analysis Characterization of Characterization of susceptibility to resiliency to perturbation perturbation Data Acquisition Monitoring of Ecosystem Indicators Assessment of ecosystem status relative to EBM goals Management Actions
Testing Ecosystem Indicators • Changes in ecosystem pressure (e.g., temperature) or ecosystem attribute of interest (trophic structure) Indicator Indicator Attribute Attribute
Project 1: Indicators of Fishing Impacts • A first cut… • For fished species, remove a fixed amount of biomass annually from standing stock • We show removals as a % of baseline biomass • After 25 years, examine changes in ecosystem structure • What indicators reveal this change?
Project 2: English Sole and Canary Rockfish Current Management Observations of Stock Stock Synthesis II Assessments and Parameter Estimation Real World Ecology 2 yr cycle Implementation + error Decision Rule
Management Strategy Evaluation Climate Indicators in Assessments and Management Decisions (w/ Ian Stewart, NWFSC) Observations of Stock Stock Synthesis II Assessments and Parameter Estimation Ecological Indicators Atlantis Ecology and Fishing Simulator 2 yr cycle Implementation + error Decision Rule
Atlantis • Management Strategy Evaluation Test monitoring, indicators, assessments and regulations • Integrating ecosystem information • Strategic planning for fisheries management
Contacts: • Phil Levin phil.levin@noaa.gov (206)860-3473 • Isaac Kaplan isaac.kaplan@noaa.gov (206)302-2446