Download
1 / 19
190 likes | 212 Views
Wavelength dependence of muscle RI and its time dependence in the course of optical clearing Luís Oliveira 1 ,2 , M. Inês Carvalho 3,4 , Elisabete Nogueira 1,2 , Valery V. Tuchin 5 , 6. 1 Physics Department, ISEP, Porto, Portugal

E N D
Wavelength dependence of muscle RI and its time dependence in the course of optical clearing Luís Oliveira1,2, M. Inês Carvalho3,4, Elisabete Nogueira1,2, Valery V. Tuchin5,6 1Physics Department, ISEP, Porto, Portugal 2CIETI – Centre of Innovation in Engineering and Industrial Technology, Porto, Portugal 3DEEC, FEUP, Porto, Portugal 4INESC Porto, Porto, Portugal 5Research-Educational Inst. of Optics and Biophotonics, Saratov State Univ., Saratov, Russia 6Inst. of Precise Mechanics and Control RAS, Saratov, Russia
1. Introduction The refractive index (RI) of biological tissues is a weighted average of the partial RIs of tissue components and it depends on wavelength [1]. Skeletal muscle, for instance, is a fibrous tissue that contains protein fiber chains immersed in sarcoplasm within the muscle cell and interstitial fluid between the various cells [2]. Its RI can be calculated from the partial RIs of hydrated fibers and sarcoplasm + interstitial fluid, using Gladstone and Dale equation[1]: (1) In equation 1, the RI of the muscle is obtained as a weighted sum of the RI of the hydrated fibers (nHF()) and the RI of the interstitial fluid and sarcoplasm (nIF+SARC()). The weight factors are the volume fractions of the components.
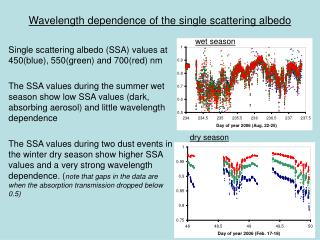
Water in fluid components has a smaller RI than solid components. This originates RI mismatch and consequently light scattering [1] [3]. Figure 1: RI mismatch in muscle. The optical immersion clearing technique is used to reduce the magnitude of the RI mismatch and consequently light scattering [1] [4]. It works through partial replacement of the water in the fluid components by an optical clearing agent (OCA) with a RI better matched to the one of solid components [3] [5]. Wavelength dependence of tissue RI (RI()) and evaluation of its time dependence during optical clearing are needed to describe the RI mismatch decrease.
The variations in the RI created by optical clearing occur only on the interstitial fluid and sarcoplasm for a treatment that lasts for ½ hour [1] [6]. A relation between the RI of these fluids and the variation of tissue’s scattering coefficient can be used to evaluate tissue RI along the treatment (for each wavelength) [1]: (2) In equation 2 we have the following parameters: • n0(t=0) and n0(t) - RI of interstitial fluid and sarcoplasm for natural tissue and at a particular time of treatment, • ns - RI of the hydrated fibers, • µs(t=0) and µs(t) - scattering coefficient of the natural tissue and at a particular time of treatment.
Knowing the scattering coefficient for natural tissue and its time dependence during treatment, equation 2 allows calculation of the time dependence for the RI of interstitial fluid and sarcoplasm. If µa<<µs (this is the case of muscle), we can assume that µa remains constant during treatment. Such characteristic allows to calculate µs from µt [7]: (3) The time dependence of µtduring treatment can be obtained from collimated transmittance (Tc) and thickness measurements, using Beer-Lambert equation [7]: (4) Using these equations, we can calculate the time dependence for the RI of muscle under optical clearing treatment.
To perform such calculations, we need only measurements of thickness and Tc collected from samples under treatment. In addition, we need also the wavelength dependence for the attenuation and scattering coefficients of the natural muscle. We have estimated these wavelength dependencies from optical measurements using inverse Monte Carlo (IMC) and inverse Adding Doubling (IAD) software codes [8] [9]. In these simulations, we have also used RI() of natural muscle. Such RI() was obtained from combination of our experimental results for 589.6 nm [10]with literature data [11].
2. Research methodology We have used abdominal wall muscle from Wistar Han rats in our studies. The complete wavelength dependence for rat muscle RI between 400 and 1000 nm was previously unknown. To obtain it, we have used our experimental data [10] for the dry fibers obtained with an Abbe refractometer at 589.6 nm, combined with literature data [11] relative to bovine muscle (same components) to retrieve wavelength dependence. Knowing all volume fractions from literature [2] [10] [12], we first calculated the RI(λ) for hydrated proteins. Then, using Gladstone and Dale equation we have combined it with the RI(λ) of water [13] to obtain the RI() for the rat muscle (calculation presented in equation 1).
Using the calculated RI(λ) of rat muscle, thickness and optical measurements obtained from 6 muscle samples, we have estimated the µa(λ) and µs(λ) with IMC and IAD codes. Using this data, thickness and optical measurements made from samples under treatment with glucose 40% and ethylene glycol (EG) 99% [5] [14], we have calculated with equation 2 the time dependence for the RI of interstitial fluid and sarcoplasm for wavelengths between 400 and 1000 nm. With Gladstone and Dale equation, we have combined the RI(λ) of hydrated fibers and interstitial fluid+sarcoplasm to obtain the RI(λ) of rat muscle for the same wavelength range at several times of treatment. Such data can be represented in terms of time dependence to evaluate variations during treatments.
3. Experimental results Literature indicates that the total water content in rat skeletal muscle is 0.756 [12]. Consequently, the dry protein fibers have a volume fraction of 0.244. From a dehydration study that we have performed with rat muscle samples, we have obtained the RI of dry proteins at 589.6 nm as 1.584 [10]. Bovine muscle contains similar protein fibers and literature indicates that it has a total water content between 0.709 and 0.741, depending on species [15]. Using published RI data for bovine muscle at different wavelengths [11], we have tried some values within the reported water content range in a modified Gladstone and Dale equation to match the wavelength dependence for the RI of dry proteins and our experimental value of 1.584.
For a water volume fraction in bovine muscle of 0.734, we have matched the RI() with our experimental value at 589.6 nm: Figure 2: Wavelength dependence for dry proteins in rat muscle. Using data from figure 2, the wavelength dependence for water RI [13] and correspondent volume fractions for rat muscle [12], we have calculated the wavelength dependence of the RI of rat muscle: (5)
The wavelength dependence of muscle RI calculated from equation 5 matches our experimental measurements at 589.6 nm (RI(589.6nm)=1.394): Figure 3: RI of rat muscle between 400 and 1000 nm. Figure 4 presents various wavelength dependencies for tissue RI (for comparison): Figure 4: Wavelength dependence for water and tissue RI.
To calculate the variation of the RI() of muscle during the treatments with glucose 40% and EG 99%, we had to discriminate between volume fractions of bound and free water. Table 1 presents data from literature [2] that was confirmed from our diffusion studies [5] [14]: Table 1: Volume fractions for rat muscle components. Using Gladstone and Dale equation to combine the data for bound water and dry proteins we have obtained the RI() for hydrated proteins. Such RI() remains unchanged during optical clearing.
The first step to estimate the time dependence of the RI of interstitial fluid and sarcoplasm consisted on obtaining with equations 3 and 4 the time dependence for µt and µs from Tc and thickness measurements: Figure 5: Tissue’s µt(t) and µs(t) for =650 nm during the treatments with glucose 40% (left) and EG 99% (right). We can now use µs(,t) in equation 2 to calculate the time dependence for the RI of interstitial fluid and sarcoplasm.
Figure 6 presents those results for both treatments: Figure 6: RI(,t) for ISF and sarcoplasm for the treatments with glucose 40% (left) and EG 99% (right). Using the thickness measurements made from samples along the treatments, we have calculated the time dependence for the volume fractions of tissue components. Such time dependences are presented on figure 7:
Figure 7: Time dependence of the volume fractions of tissue components during the treatments with glucose 40% (left) and EG 99% (right). Using the time dependencies for the RI of tissue fluids and volume fractions represented in figures 6 and 7 and the wavelength dependence of hydrated proteins, we have calculated the time dependence of muscle samples during the treatments with glucose 40% and EG 99%.
Figure 8: Time dependence of the RI of the muscle for the treatments with glucose 40% (left) and EG 99% (right). As we can see from figure 8, the RI of the muscle increases during the treatments with glucose 40% and EG 99%. In both treatments, tissue RI shows an initial strong increase as a result of tissue dehydration at this early stage of treatment. At later stage of treatment, tissue RI tends to stabilize as a result of the saturation regime.
4. Conclusions We have used a simple method based on thickness and Tc measurements that allows estimating the increase in the RI of the muscle under optical clearing treatment. With this study, we have confirmed that optical clearing treatments increase the RI of the biological tissue and consequently turn it more transparent due to the decrease of light scattering. We have also seen that the magnitude of the variations in the RI of tissue depends on the OCA used and its concentration in the immersing solution. EG 99% induces higher magnitude variations than glucose 40%. We intend to perform similar studies with other tissues/OCAs to obtain similar information about RI variation during optical clearing.
References Tuchin V V 2006 Optical Clearing of Tissues and Blood (Bellingham, WA: SPIE Press). Haskell R. C., Carlson F. D. and Blank P. S., Form birefringence of muscle, Biophys. J., 56, 401-413, 1989. Oliveira L., Carvalho M. I., Nogueira E. and Tuchin V. V., Optical measurements of rat muscle samples under treatment with ethylene glycol and glucose, J. Innovative Optical Health Sciences 6(2), 1350012-1 - 15, 2013. Jiang J., Chen W., Gong Q. and Xu K., Quantitative control of optical clearing effects studied with tissue like phantom, J. Innovative Optical Health Sciences 3(3), 195-202, 2010. Oliveira L, Carvalho M I, Nogueira E and Tuchin V V, The characteristic time of glucose diffusion measured for muscle tissue at optical clearing, Laser Physics 23, 075606-1-6, 2013. Schultz B., Chan D., Bäckström J. and Rübhausen M., Spectroscopic ellipsometry on biological materials – investigation of hydration dynamics and structural properties, Thin Solid Films, 455-456, 731-734, 2004. Tuchin V. V. 2015 Tissue Optics: Light Scattering Methods and Instruments for Medical Diagnosis (3rd edition, PM 254, Bellingham, WA:SPIE Press). Wang L., Jacques S. L. and Zheng L., MCML – Monte Carlo modeling of light transport in multi-layered tissues, Computer Methods and Pograms in Biomedicine 47, 131-146, 1995.
Prahl S. A., van Gemert M. J. C. and Welch A. J., Determining the optical properties of turbid media by using the adding-doubling method, Appl. Opt. 32, 559-568, 1993. Oliveira L., Lage A. S., Pais Clemente M. and Tuchin V. V., Optical characterization and composition of abdominal wall muscle from rat, Optics and Lasers in Engineering 47(6), 667-672, 2009. Bolin F. P., Preuss L. E., Taylor R. C. and Ference R. J., Refractive index of some mammalian tissues using a fiber optic cladding method, Applied Optics 28(12), 2297-2303,1989. Reinoso R. F., Telfer B. A. and Rowland M., Tissue water content in rats measured by desiccation, J. Pharmacological and Toxicological Methods 38, 87-92, 1997. Daimon M. and Masumura A., Measurement of the refractive index of distilled water from the near-infrared region to the ultraviolet region, Applied Optics 46(18), 3811-3820, 2007. Oliveira L., Carvalho M. I., Nogueira E. and Tuchin V. V., Diffusion characteristics of ethylene glycol in skeletal muscle, J. Biomedical Optics 20(5), 051019-1-10, 2015. Ginzburg A. S., Gromov M. A. and Krasovskaya G. I., Handbook on thermophysical characteristics of food products, Moscow: Agropromizdat, 1990. Hale G. M. and Querry M. R., Optical constants of water in the 200-nm to 200-µm wavelength region, Applied Optics 12(3), 555-563, 1973. Cheng S., Shen H. Y., Zhang G., Huang C. H. and Huang X. J., Measurement of the refractive index of biotissues at four laser wavelengths, Proc. SPIE Vol. 4916, 172-176, 2002. Ma X., Lu J. Q., Ding H. and Hu X., Bulk optical parameters of porcine skin dermis at eight wavelengths from 325 to 1557 nm, Optics Letters 30(4), 412-414, 2005.