Download
1 / 101
1.05k likes | 1.24k Views
Introduction to translational and clinical bioinformatics Connecting complex molecular information to clinically relevant decisions using molecular profiles. Alexander Statnikov Ph.D. Director, Computational Causal Discovery laboratory

E N D
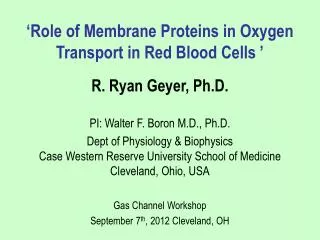
Introduction to translational and clinical bioinformaticsConnecting complex molecular information to clinically relevant decisions using molecular profiles Alexander Statnikov Ph.D. Director, Computational Causal Discovery laboratory Assistant Professor, NYU Center for Health Informatics and Bioinformatics, General Internal Medicine Constantin F. Aliferis M.D., Ph.D.,FACMI Director, NYU Center for Health Informatics and Bioinformatics Informatics Director, NYU Clinical and Translational Science Institute Director, Molecular Signatures Laboratory, Associate Professor, Department of Pathology, Adjunct Associate Professor in Biostatistics and Biomedical Informatics, Vanderbilt University
Overview • Session #1: Basic Concepts • Session #2: High-throughput assay technologies • Session #3: Computational data analytics • Session #4: Case study / practical applications • Session #5: Hands-on computer lab exercise
Supervised learning: use the known phenotypes (a.k.a “labels) in training data to build signatures or find markers highly specific for that phenotype
In 2-D looks good but what happens in: • 10,000-50,000 (regular gene expression microarrays, aCGH, and early SNP arrays) • >500,000 (tiled microarrays, new SNP arrays) • 10,000-300,000 (regular MS proteomics) • >10, 000, 000 (LC-MS proteomics) This is the ‘curse of dimensionality problem’
High-dimensionality (especially with small samples) causes: • Some methods do not run at all (classical regression) • Some methods give bad results (KNN, Decision trees) • Very slow analysis • Very expensive/cumbersome clinical application • Tends to “overfit”
Two (very real and very unpleasant) problems: Over-fitting & Under-fitting • Over-fitting ( a model to your data)= building a model that is good in original data but fails to generalize well to fresh data • Under-fitting ( a model to your data)= building a model that is poor in both original data and fresh data
Intuitive explanation of overfitting & underfitting • Play the game: find rule to predict who are the instructors in any given class (use today’s class to find a general rule)
Over/under-fitting are directly related to the complexity of the decision surface and how well the training data is fit Outcome of Interest Y This line is good! This line overfits! Training Data Future Data Predictor X
Over/under-fitting are directly related to the complexity of the decision surface and how well the training data is fit Outcome of Interest Y This line is good! This line underfits! Training Data Future Data Predictor X
Very Important Concept: • Successful data analysis methods balance training data fit with complexity. • Too complex signature (to fit training data well) overfitting (i.e., signature does not generalize) • Too simplistic signature (to avoid overfitting) underfitting (will generalize but the fit to both the training and future data will be low and predictive performance small).
Challenges in Computational Analysis of omics data for development of molecular signatures Rashomon effect/ Marker multiplicity Assay validity/ reproducibility Research Designs Efficiency: Statistical/ Computational Is there predictive signal? Data Analytics of Molecular Signatures Causality vs predictiveness/ Biological Significance Methods Development: Re-inventing the wheel & specialization Epistasis Many variables, small sample, noise, artifacts Instability Performance: Predictivity, compactness Protocols/Guidelines Editorializing/ Over-simplifying/ Sensationalism
P O A E C D B K T H I J Q L M N Part of the Solution: feature selection
Datasets • Bhattacharjee2 - Lung cancer vs normals [GE/DX] • Bhattacharjee2_I - Lung cancer vs normals on common genes between Bhattacharjee2 and Beer [GE/DX] • Bhattacharjee3 - Adenocarcinoma vs Squamous [GE/DX] • Bhattacharjee3_I - Adenocarcinoma vs Squamous on common genes between Bhattacharjee3 and Su [GE/DX] • Savage - Mediastinal large B-cell lymphoma vs diffuse large B-cell lymphoma [GE/DX] • Rosenwald4 - 3-year lymphoma survival [GE/CO] • Rosenwald5 - 5-year lymphoma survival [GE/CO] • Rosenwald6 - 7-year lymphoma survival [GE/CO] • Adam - Prostate cancer vs benign prostate hyperplasia and normals [MS/DX] • Yeoh - Classification between 6 types of leukemia [GE/DX-MC] • Conrads - Ovarian cancer vs normals [MS/DX] • Beer_I - Lung cancer vs normals (common genes with Bhattacharjee2) [GE/DX] • Su_I - Adenocarcinoma vs squamous (common genes with Bhattacharjee3) [GE/DX • Banez - Prostate cancer vs normals [MS/DX]
Methods: Gene and Peak Selection Algorithms • ALL - No feature selection • LARS - LARS • HITON_PC - • HITON_PC_W - HITON_PC+ wrapping phase • HITON_MB - • HITON_MB_W - HITON_MB + wrapping phase • GA_KNN - GA/KNN • RFE - RFE with validation of feature subset with optimized polynomial kernel • RFE_Guyon - RFE with validation of feature subset with linear kernel (as in Guyon) • RFE_POLY - RFE (with polynomial kernel) with validation of feature subset with polynomial optimized kernel • RFE_POLY_Guyon - RFE (with polynomial kernel) with validation of feature subset with linear kernel (as in Guyon) • SIMCA - SIMCA (Soft Independent Modeling of Class Analogy): PCA based method • SIMCA_SVM - SIMCA (Soft Independent Modeling of Class Analogy): PCA based method with validation of feature subset by SVM • WFCCM_CCR - Weighted Flexible Compound Covariate Method (WFCCM) applied as in Clinical Cancer Research paper by Yamagata (analysis of microarray data) • WFCCM_Lancet - Weighted Flexible Compound Covariate Method (WFCCM) applied as in Lancet paper by Yanagisawa (analysis of mass-spectrometry data) • UAF_KW - Univariate with Kruskal-Walis statistic • UAF_BW - Univariate with ratio of genes between groups to within group sum of squares • UAF_S2N - Univariate with signal-to-noise statistic
Classification Performance (average over all tasks/datasets)
Number of Selected Features (average over all tasks/datasets)
Number of Selected Features (average over all tasks/datasets)
Conclusions so far • Special classifiers (with inherent complexity control) combined with feature selection & careful parameterization protocols overcome over-fitting & estimate future performance accurately. • Caveats: analysis is typically complex and error prone. Need: (a) an experienced analyst on the team, or (b) a validated software system designed for non-experts.
Software • Causal Explorer • Gems • Fast-aims
Causal Explorer • Matlab library of computational causal discovery and variable selection algorithms • Introductory-level library to our causal algorithms • Discover the direct causal or probabilistic relations around a response variable of interest (e.g., disease is directly caused by and directly causes a set of variables/observed quantities). • Discover the set of all direct causal or probabilistic relations among the variables. • Discover the Markov blanket of a response variable of interest, i.e., the minimal subset of variables that contains all necessary information to optimally predict the response variable. • Code emphasizes efficiency, scalability, and quality of discovery • Requires relatively deep understanding of underlying theory and how the algorithms operate
Statistics of Registered Users • 739 registered users in >50 countries. • 402 (54%) users are affiliated with educational, governmental, and non-profit organizations • 337 (46%) users are either from private or commercial sectors. • Major commercial organizations that have registered users of Causal Explorer include: • IBM • Intel • SAS Institute • Texas Instruments • Siemens • GlaxoSmithKline • Merck • Microsoft
Statistics of Registered Users Major U.S. institutions that have registered users of Causal Explorer:
There exist many good software packages for supervised analysis of microarray data, but… • Neither system provides a protocol for data analysis that precludes overfitting. • A typical software either offers an overabundance of algorithms or algorithms with unknown performance. • The software packages address needs only of experienced analysts. Other systems for supervised analysis of microarray data
Classification model Cross-validation performance estimate Reduced set of genes Links to literature Purpose of GEMS Gene expression data and outcome variable GEMS Optional: Gene names & IDs (model generation & performance estimation mode)
Model predictions Performance estimate Purpose of GEMS Gene expression data and unknown outcome variable GEMS Classification model (model application mode)
Cross-Validation Designs Classifiers N-Fold CV One-Versus-Rest LOOCV One-Versus-One DAGSVM MC-SVM Method by WW Method by CS Methods Implemented in GEMS GeneSelection Methods Normalization Techniques S2N One-Versus-Rest S2N One-Versus-One [a, b] Non-param. ANOVA (x – MEAN(x)) / STD(x) (x – MEAN(x)) / STD(x) BW ratio x / STD(x) x / STD(x) HITON_MB HITON_MB x / MEAN(x) x / MEAN(x) Performance Metrics HITON_PC HITON_PC x / MEDIAN(x) x / MEDIAN(x) x / NORM(x) x / NORM(x) Accuracy x – MEAN(x) x – MEAN(x) RCI x – MEDIAN(x) x – MEDIAN(x) AUC ROC AUC ROC ABS(x) ABS(x) x + ABS(x) x + ABS(x)
Cross-Validation Loop for Performance Est. N-Fold CV Computational Engine LOOCV Normalization II II Estimate classification performance Cross-Validation Loop for Model Selection Gene Selection S2N One-Versus-Rest N-Fold CV I Generate a classification model and estimate its performance S2N One-Versus-One I I Non-param. ANOVA LOOCV II BW ratio Classification by MC-SVM Generate a classification model HITON_PC Performance Computation HITON_MB One-Versus-Rest Apply existing model to a new set of patients One-Versus-One Accuracy DAGSVM RCI Method by WW AUC ROC X Method by CS Report Generator Software Architecture of GEMS GEMS 2.0 Wizard-Like User Interface
GEMS 2.0: Wizard-Like Interface Task selection Dataset specification Cross-validation design Normalization Logging Performance metric Gene selection Classification Report generation Analysis execution
GEMS 2.0: Wizard-Like Interface Input microarray gene expression dataset File with gene names File with gene accession numbers Output model
Statistics of registered users • 800 users in >50 countries • 350 academic & non-profit users • 450 private & commercial users • 205 scientific citations of major paper that introduced GEMS • Major commercial organizations that have registered users of Causal Explorer include: • Eli Lilly − Novartis • IBM − GE • Genedata − Nuvera Biosciences • GenomicTree − Cogenetics • Pronota
FAST-AIMS • FAST-AIMS is a system to support automatic development of high-quality classification models and biomarker discovery in mass spectrometry proteomics data • Incorporates automated data analysis protocols of GEMS • Deals with additional challenges of MS data analysis
Causal interpretability • Results are causally interpretable if selected genes/proteins are in close causal proximity (e.g., upstream or downstream) with target phenotype • Importance: • Useful for biomedical discovery (e.g., suggests new drug targets) • Useful for predictivity (i.e., signatures less sensitive to distribution shifts)
Visual demonstration of Causal Graph approach for signature causal interpretability
Ntzani EE, Ioannidis JP. Predictive ability of DNA microarrays for cancer outcomes and correlates: an empirical assessment. Lancet 2003 Nov 1;362(9394):1439-44. Large systematic review that evaluated the methods of 84 gene expression microarray studies for clinical outcome prediction and provided analyses suggesting that the majority (86%) likely report biased estimates of predictive error.
Michiels S, Koscielny S, Hill C. Prediction of cancer outcome with microarrays: a multiple random validation strategy. Lancet 2005;365(9458):488-92. Carried out a re-analysis of 7 of the datasets studied by Ntzani et al that were available publicly and had sample sizes large enough to allow for reliable re-analysis. The authors concluded that: “Five of the seven largest published studies addressing cancer prognosis did not classify patients better than chance”
Michiels S, Koscielny S, Hill C. Prediction of cancer outcome with microarrays: a multiple random validation strategy. Lancet 2005;365(9458):488-92.
Michiels S, Koscielny S, Hill C. Prediction of cancer outcome with microarrays: a multiple random validation strategy. Lancet 2005;365(9458):488-92. “… the list of genes included in a molecular signature (based on one training set and the proportion of misclassifications seen in one validation set) depends greatly on the selection of the patients in training sets.”
Claim #4:Microarray clinical outcome prediction is “noise discovery”
Michiels S, Koscielny S, Hill C. Prediction of cancer outcome with microarrays: a multiple random validation strategy. Lancet 2005;365(9458):488-92. The promise of microarrays has been of apocalyptic dimensions. As put forth by one of their inventors, “all human illness can be studied by microarray analysis, and the ultimate goal of this work is to develop effective treatments or cures for every human disease by 2050”. All diseases are to be redefined, all human suffering reduced to gene-expression profiles. Cancer has been the most common early target of this revolution and publications in the most prestigious journals have heralded the discovery of molecular signatures conferring different outcomes and requiring different treatments. Yet, in today’s Lancet, Stefan Michiels and colleagues show that, on close scrutiny, in five of the seven largest studies on cancer prognosis, this technology performs no better than flipping a coin. The other two studies barely beat horoscopes. Why such failure?
Ioannidis JP. Microarrays and molecular research: noise discovery? Lancet 2005 Feb 5;365(9458):454-5. “…as Michiels and colleagues show, the selected “important” genes rarely coincide across random replicates. Published estimates often seem excessively optimistic, probably due to serendipitous selection bias either in the analysis mode or in the validation process.” …Sample size is also essential…. there is no free lunch in good research. Microarrays need evidence and this cannot be obtained from a couple of small studies, no matter how high-tech. Small sample sizes might actually hinder the identification of truly important genes….we should aim for many independent studies with a total of several thousand patients, a hundred-fold more than the current standard”.