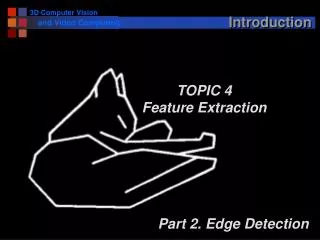
Canny’s Algorithm for Edge Detection
Canny’s Algorithm for Edge Detection. David Bisaccia. Objectives. History and Application Gray Scale vs. Color Convolution Mask Gradient Image Peaks Double Threshold and Final Peaks Output. History. Developed by John Canny in 1986. Application. Used to find edges in images

Canny’s Algorithm for Edge Detection
E N D
Presentation Transcript
Canny’s Algorithm for Edge Detection David Bisaccia
Objectives • History and Application • Gray Scale vs. Color • Convolution Mask • Gradient Image • Peaks • Double Threshold and Final Peaks • Output
History • Developed by John Canny in 1986
Application • Used to find edges in images • Can be used for defense, security, and much more • Face Detection or Human Detection
Objectives • History and Application • Gray Scale vs. Color • Convolution Mask • Gradient Image • Peaks • Double Threshold and Final Peaks • Output
Gray Scale vs. Color • Color typically isn’t need when looking for edges • Less Computation in gray scale, no R,B,G,A
Objectives • History and Application • Gray Scale vs. Color • Convolution Mask • Gradient Image • Peaks • Double Threshold and Final Peaks • Output
Loud Noises! • Images can have noise in them • Heat waves • Dust • Smoke • Acquisition Noise
Solution: Convolution Mask • Suppresses Noise • Averages a pixel with surrounding pixels • Simple mask below • Scan the convolution mask below across the target image (dot product) • Ignore the edges, usually don’t matter
Dot Product Applied Before Convolution: * = 35 After Convolution: Table Current Pixel Overlapped pixel’s with Mask (needed for dot product)
Gaussian Mask • Uses Gaussian Mask • Sigma is a value chosen by you • X and Y are the distances away from target pixel • Range from positive to negativeMask Radius • Mask Radius = 3 * Sigma
Gaussian Mask: Pseudo Code intMaskx[][], Masky[][]; Sigma = 3; intMaskRadius = Sigma * 3; For P = -MaskRadius to +MaskRadius For Q = -MaskRadius to +MaskRadius Maskx[P+MaskRadius][Q+MaskRadius] = -Q*e^(-(P*P + Q*Q)/(2*Sigma)); Masky[P+MaskRadius][Q+MaskRadius] = -P*e^(-(P*P + Q*Q)/(2*Sigma));
Applying the Gaussian Mask • Need to convolve the target picture with the Gaussian Mask • Need to do it for the X and Y directions • Yields a output convolved X and output convolved Y matrix (outConvX, outConvY)
Applying the Mask: Pseudo Code For i = MaskRadius to Picture Max Row – MaskRadius For j =MaskRadius to Picture Max Column MaskRadius -Convolve the current pixel, Pic[i][j], with the maskX -Save result in outConvX[][] -Convolve the current pixel, Pic[i][j], with the maskY -Save result in outConvY[][]
Objectives • History and Application • Gray Scale vs. Color • Convolution Mask • Gradient Image • Peaks • Double Threshold and Final Peaks • Output
Gradient Image • Achieved by obtaining the magnitude for each pixel from the outConvX[][] and the outConvY[][] • Saved in a matrix named Magnitude[][] • Iterate through each pixel i and j • Magnitude[i][j] =
Getting the Slope • Slope = Δy/ Δx • Slope = • The slope for each pixel will determine what neighboring pixels will be compared with the current pixel
Getting the Slope (cont.) • If slope -22.5 to 22.5 • If slope 22.5 to 67.5 • If slope -67.5 to -22.5 • Else Table Relevant Neighbor Pixel Current Pixel
Example Slope • The slope for each pixel will determine what neighboring pixels will be compared with the current pixel • Compare the Red Neighbors with Current Pixel Value(Green) • A slope of 10 degrees • A slope of 85 degrees Table Relevant Neighbor Pixel Current Pixel
Objectives • History and Application • Gray Scale vs. Color • Convolution Mask • Gradient Image • Peaks • Double Threshold and Final Peaks • Output
Peaks • Peaks is represented as a boolean matrix for each pixel of the image, peak[][] • If it is true, then that pixel is considered a possible peak • If false, then that pixel is not a peak
Getting Peaks • For each pixel use the relevant neighbor pixel magnitudes and compare with the current pixel’s magnitude • If current pixel’s Magnitude[i][j] > relevant pixel’s Magnitude[i][j] • Then peak[i][j] = true • Else peak[i][j] = false
Example of Peaks • The matrix is represented with valuesof the pictures Magnitude[][] • Since current pixel’s Magnitude[i][j] > relevant pixel’s Magnitude[i][j] • peak[i][j] = true • Since current pixel’s Magnitude[i][j] < relevant pixel’s Magnitude[i][j] • peak[i][j] = false
Objectives • History and Application • Gray Scale vs. Color • Convolution Mask • Gradient Image • Peaks • Double Threshold and Final Peaks • Output
Double Threshold • Final[] is another boolean matrix that represents peak values that are accepted by the double threshold • High Threshold • Values is selected by the programmer • If the Magnitude[] > High Threshold and peak[] == true then that pixel is a peak in Final[] • Low Threshold • Value is selected by the programmer • If the Magnitude[] > Low Threshold and peak[] == trueand that pixel has a neighboring pixel that is connected to a pixel with a high threshold
Getting the High Threshold For i = 0 to Row length For j = 0 to column length if(peak[i][j] == true && magnitude[i][j] > High) peak[i][j] = false final[i][j] = true else if(peak[i][j] == false && magnitude[i][j] < Lo) peak[i][j] == false final[i][j] == false
Example High Threshold Threshold: 80 Peak Table Final Table Magnitude Table Table True Peak True Final False Peak False Final
Getting The Low Threshold MoreToDo = On While(MoreToDo == On) For i = 0 to Row length For j = 0 to column length if(Final[i][j] == true) For p = -1 to 1 For q = -1 to 1 if(peak[i+p][j+q] == true) Final[i+p][j+q] == true peak[i+p][j+q] = false MoreToDo = On
Example Low Threshold General Peaks Table with High and Low: Final Table: Table Low Peak High Peak True Final False Peak False Final
Objectives • History and Application • Gray Scale vs. Color • Convolution Mask • Gradient Image • Peaks • Double Threshold and Final Peaks • Output
Output For i = 0 to Row length For j = 0 to column length if(Final[i][j] == true) print white pixel else print black pixel
Example Inputs and Outputs Input Magnitude Peaks Output:
Home Work Is this a peak?
Sources • Machine Vision : Theory, Algorithms, Practicalities. E.R. Davies • Wikipedia for pictures