Download
1 / 23
230 likes | 244 Views
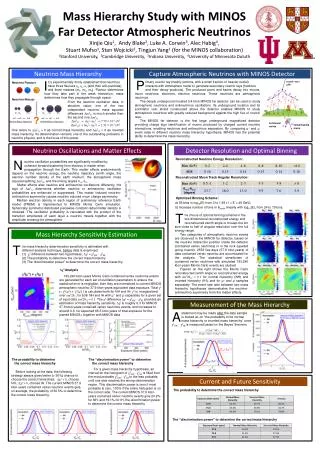
This study examines the neutrino event topologies detected in the MACRO experiment, including throughgoing muons, upward-going muons, and internal interactions. It also investigates the effects of neutrino oscillations on these events.

E N D
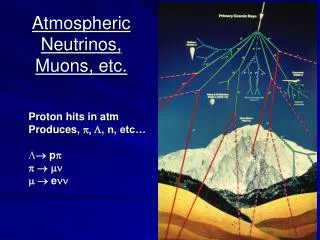
Atmospheric Neutrinos Barry Barish MACRO Bari, Bologna, Boston, Caltech, Drexel, Indiana, Frascati, Gran Sasso, L’Aquila, Lecce, Michigan, Napoli, Pisa, Roma I, Texas, Torino
Neutrino event topologies in MACRO Absorber Streamer Scintillator (4) (1) (3) (2) Detector mass ~ 5.3 kton Event Rate: (1) up throughgoing m(ToF) ~160 /y (2) internal upgoing m (ToF) ~ 50/y (3) internal downgoing m(no ToF) ~ 35/y (4) upgoing stopping m (no ToF) ~ 35/y
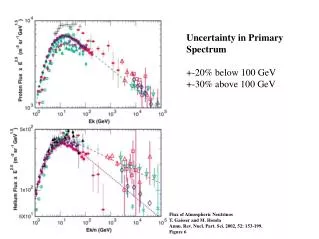
Energy spectra of n events detected in MACRO • <E> ~ 100 GeV for throughgoing m • <E> ~ 5 GeV for internal upgoing m • <E> ~ 4 GeV for internal downgoing m and for upgoing stopping m • Low energy events allow us to investigate the n oscillation parameter space independently of the throughgoing muon data
m Neutrino induced upward-going muons identified by the time-of-flight method n scintillator streamer track scintillator T2-T1) * c / l
Upward throughgoing muons External n-interactions 768 events upward vs downward muons
Background source for nm events: pion production by downward m’s • (MACRO Collab., Astroparticle Phys. 9(‘98)105) • rate of downgoing m’s ~105x rate of upgoing m’s • background mainly pions produced at large angles by • m interactions in the rock around the detector • (m + N m + p± + X) • Estimated background in MACRO: • ~ 5% for the stopping muon sample • (MACRO Coll., PL B478 (‘00) 5) • ~ 1% for the up-throughgoing m (>200 g/cm2 cut) • MACRO Coll., PL B434 (‘98) 451)
Pion production at large angle • upgoing charged p produced by m interactions in the rock under the detector • a background source for upward stopping and throughgoing muons • studied 243 events with downgoing m plus upgoing particles • Estimated background - upward throughgoing m’s: ~1% • - low energy events: ~5%
Total observed flux and comparison with Monte Carlo • Data • number of events: 768 events • background (wrong b) 18 • background (p’s from muons) 12.5 • Internal neutrino interactions 14.6 • Total 723 events • Prediction (Monte Carlo) 989 ± 17% • Bartol neutrino Flux (±14%) • GRV-LO-94 cross section (± 9%) • Lohmann muon energy loss (± 5%) • data/prediction R = 0.731 • ± 0.028stat ± 0.044syst ± 0.124theor
Effects of nm oscillations on MACRO events Flux reduction depending on zenith angle for the upward throughgoing events underground detector L ~ 10 - 104 km n Earth distortion of the angular distribution
Zenith angle distribution E > 1 GeV
Probabilities of nm nt oscillations (for maximal mixing) Probability • The peak probability from the angular distribution agrees with the peak probability from the total number of events • Probability for no-oscillation: ~ 0.4 %
Probabilities for sterile neutrino oscillations with maximum mixing Probability • Peak probabilities lower than that for tau neutrinos: • from the angular distribution: 4.1 % • from combination: 14.5 %
Probabilities for sterile neutrino oscillations
Test of oscillations with the ratio vertical / horizontal • Ratio (Lipari- Lusignoli, Phys Rev D57 1998) can • be statistically more powerful than ac2test: • 1) the ratio is sensitive to the sign of the deviation • 2) there is gain in statistical significance • Disadvantage: the structure in the angular distribution of data can be lost. Measured value ~ 2 s (and one sided) from the expected value for sterile neutrino
Internal Downgoing m’s and Upward Going Stopping m’s Internal downgoing Upward going stopping from MC simulation: • En ~ 4 GeV • mixture • upward going stopping m ~ 50% • internal downgoing m ~ 50% • ~ 87% from nm –charged current events DATA - Background = 229 events
Data vs Monte Carlo Predictions Low Energy Neutrino Events • Fn: Bartol n flux with geomagnetic cutoffs • (error ~ 20%) • sn = Q.E. + 1p(Lipari et al., PRL74 (1995) 4384) • + DIS (GRV-LO-94 PDF) (error ~ 15%) • e(Em,qzenith): detector response and acceptance • (systematic error ~ 10 %) Internal upward going m’s MC: 247 ± 25sys± 62theo DATA: 135 ± 12stat Internal down + Upgoing stop MC: 329 ± 33sys± 82theo DATA: 229 ± 15stat
Internal upward events expected 247 ± 62thor real data 135 ± 12stat - - -146 events maximum mixing m2= 2.5 x 10⁻³ eV 2 • Data consistent with a constant deficit in all • zenith angle bins ( 2 /d.o.f. = 3.1/4 on shape) • Probability for NO oscillations: ~ 4.3% (one side)
Internal downward + Upward stopping events expected 329 ± 82th real data 229 ± 15stat - - -252 events maximum mixing m2= 2.5 x 10⁻³ eV 2 • Data consistent with a constant deficit in all • zenith angle bins • Probability for NO oscillations: ~ 12% (one side)
Ratio of event types at low energy (Internal upward) / (Internal downward + Upward stopping) • Most of the theor. uncertainties canceled (<5%) • Systematic errors reduced (~6%) • Data: R = 0.59 ± 0.07stat • Expected (No oscillations): R = 0.75 ± 0.04sys ± 0.04th • compatibility ~ 2.7% • Expectedoscillations R = 0.58 ± 0.03sys ± 0.03th • (maximal mixing andm2 = 2.5 x 10⁻³ eV2 )
Ratio of event types at low energy upgoing internal internal downgoing + upgoing stop • Most of the theor. uncertainties canceled < 5% • Systematic errors reduced ~ 6% • Data: R = 0.59 ± 0.07stat • Expected (No oscillations):R = 0.75 ± 0.04sys ± 0.04th • ExpectedoscillationsR = 0.58 ± 0.03sys ± 0.03th maximal mixing m2 = 2.5 x 10⁻³ eV2
MACRO n events: confidence level regions for nm ntoscillation
Summary and Conclusions • High energy events: • nmnt oscillation favoured with large mixing angle andm2 ~ 2.5x10⁻³ eV2 • sterile n disfavoured at ~ 2 slevel • Low energy events: • event deficit with respect to expectation different for Internal upward, and internal downward + Uuward going stopping • no zenith angle distortion • compatibility between result and expectation (no oscillations) with a probability < 3 % • agreement with hypothesis ofoscillationwith large mixing angle and10-3 < m2 < 2x10⁻² eV2 • A consistent scenario arises from both high and low energy MACRO n events