Download
1 / 31
320 likes | 536 Views
Biomarker for Angiogenesis Inhibitors. Heinz-Josef Lenz Associate Director, Clinical Research Kathryn Balakrishnan Chair for Cancer Research Co-Director, USC Center for Molecular Pathways and Drug Discovery Co-Leader GI Oncology Program USC/Norris Comprehensive Cancer Center.

E N D
Biomarker for Angiogenesis Inhibitors Heinz-Josef Lenz Associate Director, Clinical Research Kathryn Balakrishnan Chair for Cancer Research Co-Director, USC Center for Molecular Pathways and Drug Discovery Co-Leader GI Oncology Program USC/Norris Comprehensive Cancer Center
Significant research to date to identify bevacizumab biomarkersa Breast CRC NSCLC Other 2011 VEGF-A, VEGF-B, MVD neuropilin, HER2, EGFR bFGF, HGF, PlGF,SDF-1, MCP-3 pVEGF-A CECs 2010 VEGF-A, VEGFR-1/2, MVD neuropilin, HER2, EGFR Polymorphisms DCE-MRI CTCs, CECs Collagen IV, VEGF-A CD31, VEGF-A, Ki67, KRAS/BRAF (solid tumours) VEGF-A, VCAM, ICAM,bFGF, E-selectin KRAS mutation VEGF-A, sVEGFR-1, IL-6, CECs, PlGF (rectal) CECs, MMP-2/9, VEGF-A, sVEGFR-2, IL-6/8, PlGF (HCC) VEGF-A, bFGF, E-selectin,VCAM-1, ICAM-1 Polymorphisms CECs Ktrans, MVV, collagen IV (glioblastoma) Polymorphisms (pancreas) 2009 CECs, CTCs VEGF-A, VEGFR-2, CA9,HIF-2α (astrocytoma) MVD, CD34, CD31(solid tumours) EGFR, KRAS Polymorphisms CA125 (ovarian) CTCs VEGF-A, VEGFR, VCAM (NHL) CECs, FDG-PET (rectal) VEGF-A, VCAM, ICAM, bFGF, E-selectin Polymorphisms SDF1α, PlGF, Ang 1/2, neuropilin-1, CXCR4, CXCL6 (rectal) CTCs, CECs, VEGFR-2 (solid tumours) VEGF-A, bFGF, ICAM,E-selectin VEGF-A, VEGFR-2, CD31, CA9, HIF-2α (glioma) CECs CTCs CECs 2008 CD31-MVD (ovarian) Polymorphisms sVEGF-A, Ang-1/2 CECs Polymorphisms (ovarian) VEGF-A, THBS, CD31, p53, (ovarian) pVEGF-A DCE-MRI, PET VEGFR-2, KDR, EGFR, CD31 (H&N) Polymorphisms 2007 EGFR, VEGF-A, TS, Ki67, ERCC1, MSH2, MLH1 SDF-1α, bFGF, CECs(glioblastoma) DCE-MRI, FDG-PET (solid tumours) E-selectin, P-selectin, ICAM-1,VCAM-1, PDGF, bFGF, MMP-2/9 VEGF-A, CD31, factor VIII (BCL) 2006 VEGF-A, THBS, MVD CA19-9 (pancreas) sVEGFR-2 Pre-2006 VEGF-A, CEC, VCAM, bFGF (NHL) D-dimer VEGF-A, THBS, MVD CECs, CTCs Primary paper Abstract KRAS, BRAF, p53 aData based on search in PubMed with ‘biomarker’ in abstract, all ASCO abstracts, WCGIC ‘09, ESMO GI ’08, ESMO ‘09, SABCS ’08/’09/’10.
Limited achievements with anti-angiogenic agents Cediranib Focus: Wide ranging Tumour type: Glioblastoma (two single-arm studies) Vascular normalisation index may correlate with OS1 Sunitinib Focus: VEGF, VEGFR Tumour type: Varied, predominantly single-arm studies No biomarker identified No biomarker identified Biomarker research for anti-angiogenic agents is challenging Vandetanib Focus: VEGF, VEGFR, ICAM-1 Tumour type: NSCLC Pazopanib Tumour type: RCC (one study) No biomarker identified No biomarker identified Sorafenib Focus: VEGF, CECs Tumour type: Varied, predominantly single-arm studies No biomarker identified 1Sorensen et al. Cancer Res 2009
Ferrara & Kerbel. Nature 2005;438:967–74 Reproduced with permission, Nature Publishing Group
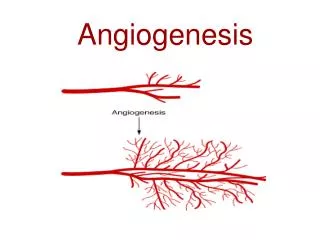
Hypoxia EGF EGFR Thrombin Thrombin PAR-1 HIf1 ARNT PAR-4 Tumor cell HIF1 NFkb DNA 2-granules 1-granules Platelet VEGF IL-8 IL-1 β VEGFR Endostatin IL-1R CXCR NRP1 Endothelial cell Tumor associated angiogenesis
Biomarker Tumor Microenvironment Host
Bevacizumab OS effect independent of tumor mutations AVF2107g mCRC Bevacizumab + chemobetter Chemo alone better 0.2 0.5 1 2 5 HR (95% CI) Ince et al. JNCI 2005
Plasma VEGF-A and VEGFR-2 levelsa: PFS AVADO mBC Interaction p-valueb Bev + chemobetter Chemo alone better 0.0136 0.0342 0.0808 0.2545 0.2 0.5 1 2 5 HR (95% CI) • In this study, data suggest that high levels of plasma VEGF-A and VEGFR-2 are associated with PFS aLevels measured using novel ELISA assay bLikelihood ratio test. Multiple logistics regression, factors included: trial treatment, biomarker level, binary stratification factors (ER/PgR status, measurable disease at baseline, prior adjuvant taxane therapy), interaction term of treatment by biomarker level Miles et al. SABCS 2010
Low VEGFR-2 High VEGFR-2 1.0 0.8 0.6 0.4 0.2 0 1.0 0.8 0.6 0.4 0.2 0 Placebo Bev 15 mg/kg Bev 7.5 mg/kg Placebo Bev 15 mg/kg Bev 7.5 mg/kg Probability 0 6 12 18 24 0 6 12 18 24 Time (months) Time (months) Plasma VEGF-A and VEGFR-2 levels: PFS AVADO mBC Low VEGF-A High VEGF-A 1.0 0.8 0.6 0.4 0.2 0 1.0 0.8 0.6 0.4 0.2 0 Placebo Bev 15 mg/kg Bev 7.5 mg/kg Placebo Bev 15 mg/kg Bev 7.5 mg/kg Probability 0 6 12 18 24 0 6 12 18 24 Time (months) Time (months) • In this study, data suggest that high levels of plasma VEGF-A and VEGFR-2 may be associated with PFS Miles et al. SABCS 2010
Plasma ICAM-1 levels: PFS and OS E4599 NSCLC Low baseline ICAM-1 High baseline ICAM-1 PFS 1.0 0.8 0.6 0.4 0.2 0 1.0 0.8 0.6 0.4 0.2 0 PC PC Bev + PC Bev + PC HR 1.00 (95% CI 0.62–1.60)* HR 2.14 (95% CI 1.31–3.48)* Probability (p=0.0018) (p=0.99) 0 10 20 30 40 50 0 10 20 30 40 50 Time (months) Time (months) Low baseline ICAM-1 High baseline ICAM-1 OS 1.0 0.8 0.6 0.4 0.2 0 1.0 0.8 0.6 0.4 0.2 0 PC PC Bev + PC Bev + PC HR 1.39 (95% CI 0.84–2.30) HR 0.90 (95% CI 0.56–1.44) Probability (p=0.66) (p=0.19) 0 10 20 30 40 50 0 10 20 30 40 50 Time (months) Time (months) • In this study, data suggest that low levels of ICAM-1 are associated with improved PFS Dowlati et al. ASCO 2006 HR shown as PC/Bev + PC. *Cox model treatment interaction tests p≤0.05
Plasma ICAM-1 and bFGF levels: PFS Placebo + CG Bevacizumab 7.5 mg/kg + CG Placebo + CG Bevacizumab 7.5 mg/kg + CG Placebo + CG Bevacizumab 15 mg/kg + CG Placebo + CG Bevacizumab 15 mg/kg + CG Low baseline bFGF 1.0 0.8 0.6 0.4 0.2 0 Probability 0 6 12 18 24 30 Time (months) AVAiL NSCLC Bevacizumab 15 mg/kg + CG Low baseline ICAM-1 High baseline ICAM-1 1.0 0.8 0.6 0.4 0.2 0 1.0 0.8 0.6 0.4 0.2 0 Probability HR 1.04* (95% CI 0.69–1.56) HR 0.64* (95% CI 0.43–0.96) 0 6 12 18 24 30 0 6 12 18 24 30 Time (months) Time (months) Bevacizumab 7.5 mg/kg + CG High baseline bFGF 1.0 0.8 0.6 0.4 0.2 0 HR 0.74* (95% CI 0.50–1.09) HR 0.47* (95% CI 0.31–0.71) 0 6 12 18 24 30 Time (months) • In this study, data suggest that low levels of ICAM-1 (bev 15 mg/kg) and high levels of bFGF (bev 7.5 mg/kg) are associated with improved PFS *Cox regression analysis treatment interaction p<0.15 Leighl et al. ECCO-ESMO 2009
Hypoxia EGF EGFR Thrombin Thrombin PAR-1 HIf1 ARNT PAR-4 Tumor cell HIF1 NFkb DNA 2-granules 1-granules Platelet VEGF IL-8 IL-1 β VEGFR Endostatin IL-1R CXCR NRP1 Endothelial cell Tumor associated angiogenesis
Il-8 251 Polymorphism predicted Response to BEV/low dose cyclophosphomide in ovarian cancer Schultheiss et al Clin Cancer Res 2008
VEGF 936 associated with PFS in metastatic ovarian cancer Schultheiss Clin Cancer Res 2008
VEGF SNPs: OS E2100 mBC VEGF-2578 VEGF-1154 1.0 0.8 0.6 0.4 0.2 0 1.0 0.8 0.6 0.4 0.2 0 AAGAGG Bev+Pac Pac AACACC Bev+Pac Pac OS probability p=0.035a p=0.047a AA vs CA + CCb HR 0.58 (98.3% CI 0.36–0.93)(p=0.023) AA vs GA vs GGb HR 0.62 (98.3% CI 0.46–0.83) (p=0.001) 0 10 20 30 40 50 60 70 0 10 20 30 40 50 60 70 Time (months) Time (months) • In this study, data suggest that AA genotypes of two VEGF SNPs are associated with improved OS • Interpretation limited: • Information on genotypes from control patients not reported • DNA samples originate from tumour tissue rather than blood • To date these SNPs have not been confirmed in other indications (E4599, AViTA) Schneider et al. JCO 2008 aAA in experimental arm vs all genotypes in control arm. bIn experimental arm only.
VEGFR-1 SNP: OS AViTA mPaC 1.0 0.8 0.6 0.4 0.2 0 Overall placebo Overall bevacizumab OS probability 0 200 400 600 800 Time on study (days) • In this study, data suggest that rs9582036-A allele is associated with improved OS (shown) and PFS (not shown) Roche data on file; Lambrechts et al. ECCO-ESMO 2009
Germline Polymorphisms (Il-8, VEGF, ICAM) associated with Response in patients enrolled in E4599 (multivariate analyses) PCB selected (44%) PCB unselected (16%) PC selected (10%) PC unselected (13%) Fisher’s test p=0.01.
PFS in Patients selected for BEV using (VEGF/IL8/ICAM) in Multivariate Analysis. HR=0.4 (0.25-0/65 95% CI) p=0.002
Overall Survival (OS) by selected SNP profile in addition to fitting a multivariable model in PCB arm HR=0.39 (CI95% 0.25-0.63) P=0.0001
Tumor VEGF-A and neuropilin expression: PFS NO16966mCRC n HR (95% CI) Category Subgroup All VEGF-A HER2 EGFR Neuropilin VEGFR-1 All First tertile Second tertile Third tertile First tertile Third tertile First tertile Second tertile Third tertile First tertile Second tertile Third tertile First tertile Second tertile Third tertile 247 0.70 (0.49–1.00) 80 0.91 (0.49–1.69) 83 0.74 (0.39–1.40) 78 0.57 (0.29–1.10) 158 0.60 (0.38–0.95) 77 0.90 (0.49–1.64) 88 0.64 (0.34–1.19) 73 0.67 (0.33–1.38) 79 0.72 (0.40–1.30) 81 0.46 (0.22–0.93) 84 0.61 (0.31–1.21) 79 0.99 (0.55–1.77) 76 0.73 (0.37–1.42) 79 0.61 (0.30–1.25) 75 0.73 (0.38–1.40) Patients with higher levels of VEGF-A show increased benefit Patients with lower levels of neuropilin show increased benefit 0.2 0.4 0.6 1 2 3 4 5 6 HR (95% CI) • In this study, data suggest that high tumour VEGF-A and low neuropilin expression are associated with improved PFS Foernzler et al. ASCO GI 2010
Tumor VEGF-A and neuropilin expression: PFS NO16966mCRC Bevacizumab biomarker ≤ median Placebo biomarker ≤ median Placebo biomarker > median Bevacizumab biomarker > median 1.0 0.8 0.6 0.4 0.2 0 Neuropilin 1.0 0.8 0.6 0.4 0.2 0 VEGF-A PFS probability 0 100 200 300 400 500 600 700 800 900 0 100 200 300 400 500 600 700 800 900 Time (days) Time (days) • In this study, data suggest that high tumour VEGF-A and low neuropilin expression are associated with improved PFS Foernzler et al. ASCO GI 2010
AVF2119gmBC Tumor marker expression: PFS • In this study, data suggest that expression of different tumour markers is associated with improved PFS Cox regression analysis of PFS for each biomarker subgroup after adjustment for stratification factor and interaction between treatment and the biomarker variable. P-values for HR were constructed on the basis of Wald tests and then adjusted for the FDR Jubb et al. Clin Cancer Res 2011
VEGFR1 mRNA predicts response to FOLFOX/PTK Response (n=93) Confirm 1 VEGFR1 (n=42) Multivariate Analysis: - Serum LDH - Age - Gender - Performance Status <3.85 ≥ 3.85 Group 1 (10%) Group 2 (61%)
High VEGFR2 associated with poor OS in CONFIRM1 P value = 0.012 Adjusted 1.0 0.9 0.8 VEGFR2 (n=38) 0.7 0.6 Estimated Probability of Survival 0.5 VEGFR2 (n=45) 0.4 0.3 0.2 0.1 0.0 0 6 12 18 24 30 36 42 48 Months since randomization VEGFR2 >1.76 35.8 mo v 20 mo
VEGFR2 CONFIRM1 VEGFR2 <2.98 (n=34) with PTK/ZK VEGFR2 > 2.98 (n=8) with PTK/ZK VEGFR2 > 2.98 VEGFR2 <2.98 (n=34) (n=7) w/o PTK/ZK w/o PTK/ZK CONFIRM 1 P for interaction between treatment and 1.0 VEGFR2 expression = 0.001 0.9 0.8 0.7 0.6 Estimated Probability of Progression-Free Survival 0.5 0.4 0.3 0.2 0.1 0.0 0 5 10 15 20 25 30 35 40 Months since randomization Gimminger in press Pharmacogenomics 2011
Conclusions • Identification of Predictive Biomarker is critical to develop Anti-VEGF therapies • VEGFA, VEGFR1,VEGFR2, Neuropilin expression levels (plasma/tumors) are promising markers which need validation • VEGF independent pathways may play a critical role in efficacy of anti-VEGF therapies (ICAM, IL8) • Collaborations between Industry, Cooperative Groups and Academics are essential to successful develop clinically useful biomarkers • Interaction between EGFR and VEGF pathways and drug resistance
Collaborations Medical Oncology: Syma Iqbal, Anthony El-Khoueiry Danenberg Lab: Peter Danenberg, Peter Grimminger ResponseGenetics: Kathy Danenberg Lenz Lab: Zhang Wu Anne Schultheiss Mizutomo Azuma Georg Lurje Alexandra Pohl Fumio Nagashima Thomas Winder, Pierre Bohanes, Yan Ning Statistics: Susan Groshen, Dongyun Yang Stem Cell Institute Michael Kahn Thank you Stefan Scherer (Genentech) for sharing Slides on Bev Biomarkers