Download
1 / 23
230 likes | 324 Views
Explore the ModeScore method to infer altered metabolic functions from transcript profiles with relevance to cellular functional layers and predictive analysis. Learn about the application examples and functional analysis outcomes. Implementation and summary provide an overview of how to apply ModeScore for transcript abundance analysis.

E N D
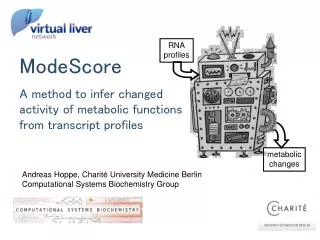
RNA profiles metabolic changes ModeScore A method to infer changed activity of metabolic functions from transcript profiles Andreas Hoppe, Charité University Medicine Berlin Computational Systems Biochemistry Group
Outline • Introduction • ModeScore method • Application example • Implementation/Summary Introduction — ModeScore — Application —Summary
Outline • Introduction • ModeScore method • Application example • Implementation/Summary Introduction — ModeScore — Application —Summary
Functional layers of cells Introduction — ModeScore — Application —Summary
Functional layers of cells Many intermediate levels • many modifying factors • quantitative predictivity low • knowledge must be integrated Gygi et al., 1999, Mol. Cell Biol. Blazier & Papin. 2012, Front Physiol. Hoppe, 2012, Metabolites 2. Why transcripts then? • large information gain per material & money • easy measurement (compared with metabolites, fluxes, proteins) • multitude of available datasets Introduction — ModeScore — Application —Summary
Objective of method Given: measured transcript abundances • Select metabolic function with the most remarkable pattern • Select the genes that • are related to this metabolic function • significantly change • have sufficiently high expression • show remarkable pattern of change Introduction — ModeScore — Application —Summary
Outline • Introduction • ModeScore method • Application example • Implementation/Summary Introduction — ModeScore — Application —Summary
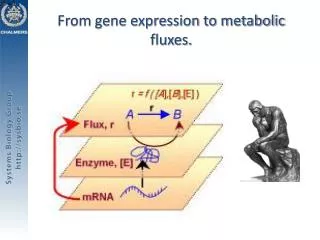
FASIMU HepatoNet1 Prediction idea We know • the way enzymes cooperatively work • the cell’s metabolic functions reference flux distributions Metabolic function definition Reference flux mode HepatoNet1 … , Gille et al., 2010, Mol Syst Biol FASIMU … Hoppe et al., 2011, BMC Bioinf Introduction — ModeScore — Application —Summary
1 mi/λ Prediction idea Assumptions: • Gene up flux value up (& vice versa) • Normal distribution • Probability maximum: flux/scaling factor Pattern match Abundance change — Flux mode Introduction — ModeScore — Application —Summary
1 mi/λ Mode set scoring Introduction — ModeScore — Application —Summary
ModeScore amplitude (1/) • Measures strength of regulation for the function • Compatible to log2 fold change • Cluster point (not average) of gene changes Contribution scores (scorei) • Measures how good a gene change represents the function’s amplitude Introduction — ModeScore — Application —Summary
ModeScore analysis • Ranking of functions by amplitude for each relative profile • Collect similar functions • Select remarkable functions • For each function, rank the genes by their contribution • Select set of genes representing the remarkable pattern Introduction — ModeScore — Application —Summary
Outline • Introduction • ModeScore method • Application example • Implementation/Summary Introduction — ModeScore — Application —Summary
Hepatocyte culture/TGF treatment Dooley, 2008, Gastroenterology Godoy, 2009, Hepatology Cuiclan, 2010, J Hepatology A B 1 2 3 C Extraction 1h 6h 24h Culture Treatment 1h 6h 24h Ilkavets, Dooley Introduction — ModeScore — Application —Summary
Ranking of functions, example TGF treated at 24h vs. control 24h Introduction — ModeScore — Application —Summary
Selection of genes, example Introduction — ModeScore — Application —Summary
Phenylalanine/Tyrosine degradation Introduction — ModeScore — Application —Summary
Ethanol degradation Introduction — ModeScore — Application —Summary
Outline • Introduction • ModeScore method • Application example • Implementation/Summary Introduction — ModeScore — Application —Summary
Implementation • Reference flux mode computation • www.bioinformatics.org/fasimu • ModeScore computation • data handling: bash/gawk • scaling factor optimization: octave • table generation: LaTeX • bargraphs, t-test: R Introduction — ModeScore — Application —Summary
RNA profiles metabolic changes Summary Introduction — ModeScore — Application —Summary
Summary Semi-automatic process • refinement of network, functions, annotations • scoring/ranking • manual selection Selection of changed genes Testable hypothesis Introduction — ModeScore — Application —Summary
Hermann-Georg Holzhütter, Berlin Matthias König, Berlin Iryna Ilkavets Mannheim Patricio Godoy, Dortmund Sebastian Vlaic, Jena Acknowledgements