Multimodal Imaging in Mood Disorders
Multimodal Imaging in Mood Disorders. Allison C Nugent, PhD August 14, 2017. Outline. What are Mood Disorders? The Neurobiology of Depression and Treatment What can imaging teach us about Depression and its treatment?. Outline. What are Mood Disorders?


Multimodal Imaging in Mood Disorders
E N D
Presentation Transcript
Multimodal Imaging in Mood Disorders Allison C Nugent, PhD August 14, 2017
Outline • What are Mood Disorders? • The Neurobiology of Depression and Treatment • What can imaging teach us about Depression and its treatment?
Outline • What are Mood Disorders? • The Neurobiology of Depression and Treatment • What can imaging teach us about Depression and its treatment?
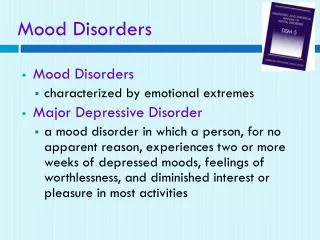
Mood Disorders • Depressive Disorders • Major Depressive Disorder • Post-partum Depression and Premenstrual Dysphoric Disorder • Seasonal Affective Disorder • Etc. • Bipolar Disorders • Bipolar Disorder Types I and II • Cyclothymia
Mood Disorders • Major Depressive Disorder • Either depressed mood or anhedonia • Changes in sleep, weight, activity; feelings of guilt or worthlessness; problems with concentration; suicidality • Treatment is empirical; many drugs, none are terribly effective • STAR*D study: 2 trials or 6 months for 50% remission
Outline • What are Mood Disorders? • The Neurobiology of Depression and Treatment • What can imaging teach us about Depression and its treatment?
Neurobiology of Depression: Core Brain Regions • Subgenual cingulate cortex, BA25 • Amygdala sgACC Amyg
The Triple Network Model Menon V, Brain Mapping: An Encyclopedic Reference, (2015), vol. 2, pp. 597-611
MDD: Pathogenesis and Treatment • Original Hypothesis : monoamine dysfunction • Norepinephrine • Serotonin • Dopamine • All currently approved drugs target the monoaminergic system # of Mechanistically Distinct Drugs
Ketamine • FDA approved anesthetic and Schedule III controlled substance • NMDA receptor antagonist • Potent psychotomimetic effects MDD Drug Drug * Hamilton Depression Rating Scale (HAMD) Placebo Placebo ** ** *** *** *** Ketamine: Investigative Tool to study Rapid Antidepressant Effects 1 7 2 3 80 230 110 40 -60 Minutes Days
Rapid acting antidepressants: A common pathway of synaptogenesis? Inhibitory Interneuron Spine Synapse Number & Function Ketamine MuscR NMDA GABA Glutamate Glutamate BDNF Glutamate Burst NMDA AMPA TrkB AMPA Ca+ GSK3 GSK3 ERK Akt Akt PP1 mTOR mTOR Adapted from Duman, 2014
Ketamine: Active Metabolite • Alternative NMDA antagonist MK-801 does not elicit an antidepressant response • Metabolite (2R,6R)-HNK does elicit an antidepressant response, but is not an NMDA antagonist • Both ketamine and (2R,6R)-HNK enhance AMPA throughput. Zanos, et al., Nature, 2016
Ketamine MOA study 14 days follow-up 14 days Placebo Ketamine (0.5 mg/kg) Medication Taper MDD (7-14 Days) Drug –free period MDD 14 days Ketamine (0.5 mg/kg) Placebo -MEG -PSG -PET -fMRI -BDNF, VEGF • metabolomics, proteomic • Metabolites BASELINE MEG 3T Multimodal MRI 7T MRI Polysomnography ACUTE MEG 3T MRI 7T MRI PSG ACUTE MEG 3T MRI 7T MRI PSG INTERIM MEG 3T MRI 7T MRI PSG INTERIM MEG 3T MRI 7T MRI PSG
Outline • What are Mood Disorders? • The Neurobiology of Depression and Treatment • What can imaging teach us about Depression and its treatment?
How can we use imaging? • Find brain “biomarkers” that can subdivide patients into distinct phenotypes • Find brain “biomarkers” that can reliably predict who will respond to a given intervention • Markers may change in response to treatment, and display a dose-response relationship
Potential Markers • Structure • Cognitive Function and Functional Imaging • Intrinsic Connectivity • Neurophysiology
Potential Markers • Structure • Cognitive Function and Functional Imaging • Intrinsic Connectivity • Neurophysiology
MDD and Brain Structure Koolschijn, et al.Human Brain Mapping (2009)
MDD and Brain Structure • High resolution hippocampal mapping at 7T • Assessing curvature, surface area, and shape 3T 7T Thomas, Goodwin et al.
MDD and Brain Structure figure 2 Significant negative association between length of current episode and reduced volume in the subicular subfield of the hippocampus. Thomas, Goodwin, et al.
Mood Disorders and Brain Structure: Cortex ENIGMA MDD Workgroup N=2148 MDD, N=7957 HC ENIGMA BD Workgroup N=2447 BD, N=4056 HC Schmaal, et al., 2016 Hibar, et al., 2017
MDD and Brain Structure: DTI • Meta-analysis • 3 TBSS studies, and 8 VBA studies • Reduced FA in CC, longitudinal fasciculus, fronto-occipital fasciculus, and thalamic radiation Liao, et al. (2013)
MDD and Brain Structure: DTI • Choi, et al. Neuropsychopharmacology (2014) 39(6):1332-1339. • MDD (N=134) and HC (N=54) • 98 treatment naïve MDD • All medication free • No differences found
MDD: Focused Analysis • Concentration on sgACC and Amygdala tracts, with additional hippocampus and thalamus regions of interest • Baseline imaging in 31 MDD and 26 HC subjects before ketamine treatment Nugent, et al., in preparation
DTI: MDD vs. HC, and response to ketamine R=0.569, p=0.001 Nugent, et al., in preparation
Recap! • Structural Imaging • Volumetric alterations in limbic and ACC areas • Alterations in corticolimbic tracts
Potential Markers • Structure • Cognitive Function and Functional Imaging • Intrinsic Connectivity • Neurophysiology
MDD and cognition • Affective Processing • Bias towards negative stimuli in depression • Attention • Dot probe tasks • Working memory and executive function • N-back task, delayed matching tasks • Reward processing
Emotion Processing: Depression • Meta-analysis • 14 rCBF and 24 fMRI studies • Hyper-reactivity in dorsal cingulate and amygdala in response to negative stimulus vs. positive or neutral stimulus • Hypo-reactivity in DLPFC and caudate Hamilton, et al. (2012) Am J Psychiatry 169(7):693-703
Emotion Processing: Depression Negative Emotions Positive Emotions • Meta-analysis • 44 fMRI studies • Hyperactivation to negative stimuli and hypoactivation to positive stimuli Groenewold, et al. (2012) Neurosci and Biobehav Rev 37(2):152-163
Dot Probe Task Happy Block: Angry Block: Congruent Trial Incongruent Trial + + Congruent Trial Control Trial
Dot Probe: Group * Emotion * Drug Interaction Reed, et al.
Dot Probe Task:Baseline Associations with Subsequent Response to Ketamine Scopolamine Ketamine r= - 0.50 p= 0.005 r= - 0.77 p< 0.05 BOLD Response (dot probe task) BOLD Response (emotion working memory task) r= + 0.76 p< 0.05 r= - 0.85 p< 0.05 Furey et al., JAMA Psychiatry, 2013. Scopolamine Szczepanik, Reed, Chung et al. Ketamine
Activity Rating Task + + Szczepanik, et al.
Activity Rating Task Brain activation varying parametrically from most disliked to most liked Szczepanik, et al.
Suicide IAT task • Predicts repeated suicide attempt at six month follow-up • Individuals who go onto attempt suicide have a stronger implicit association between themselves and death Nock, 2010; Price, 2009
Suicide IAT task “Death” with “me” block vs. “Life” with Me” Healthy controls potentially showing greater cognitive load when associating death with themselves. Cluster-defining threshold p<0.01, cluster FWE corrected at p<0.05 Reed, Ballard, Szczepanik, et al.
Recap! • Structural Imaging • Volumetric alterations in limbic and ACC areas • Alterations in corticolimbic tracts • Cognitive Function and Functional Imaging • Differential responses to negative and positive emotional stimuli differ in limbic regions and cortical regions in the three core networks • Ketamine treatment appears to reverse some neural biases • Novel tasks may uniquely assess new symptom domains
Potential Markers • Structure • Cognitive Function • Intrinsic Connectivity • Neurophysiology
MDD and the Resting State • Hyperconnectivity in the sgACC and thalamus compared to healthy subjects • These are areas of hyperactivity as shown by PET and MRI meta-analyses • Increased resting state connectivity in sgACC has been replicated in meta-analyses. Greicius, et al. (2007) Biological Psychiatry 62(5):429-37
MDD and the Resting State:Meta-analysis, 25 studies Central Executive Superior Parietal (SN) Default Mode DLPFC (CEN) Affective dACC (SN) Salience PCC (DMN) Kaiser, et al. (2015) JAMA Psychiatry 72(6):603-611
Triple Network Model Manoliu, et al. (2014) Frontiers in Human Neuroscivol 7
Resting State: Treatment Post-treatment MDD vs. HC Pre-treatment MDD vs. HC Pre-treatment MDD vs. Post-treatment MDD While posterior default mode network responds to antidepressant treatment, dysfunction in the anterior default mode network is unchanged Baojuan, et al. (2012) Biological Psychiatry 74(1):48-54
Default Mode Connectivity Group Differences by Treatment Session Evans, et al.
Default Mode Network Connectivity Treatment Effects Evans, et al.
Recap! • Structural Imaging • Volumetric alterations in limbic and ACC areas • Alterations in corticolimbic tracts • Cognitive Function and Functional Imaging • Differential responses to negative and positive emotional stimuli differ in limbic regions and cortical regions in the three core networks • Ketamine treatment appears to reverse some neural biases • Novel tasks may uniquely assess new symptom domains • Intrinsic Connectivity • Complex alterations in triple network system connectivity