Download
1 / 34
350 likes | 532 Views
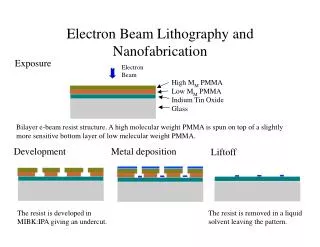
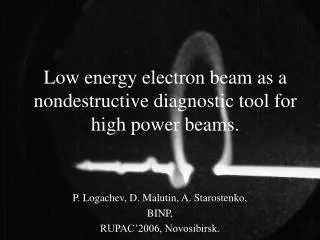
Low energy electron beam as a nondestructive diagnostic tool for high power beams. P. Logachev, D. Malutin, A. Starostenko, BINP, RUPAC’2006, Novosibirsk. Electron beam probe for RF linacs. Beam structure monitoring. Wake-fields monitoring. Monitoring of the bunch tilt.

E N D
Low energy electron beam as a nondestructive diagnostic tool for high power beams. P. Logachev, D. Malutin, A. Starostenko, BINP, RUPAC’2006, Novosibirsk.
Electron beam probe for RF linacs. • Beam structure monitoring. • Wake-fields monitoring. • Monitoring of the bunch tilt. • Bunch-to-bunch position monitoring.
Electron Beam Probe • basic idea • scheme • EBP at VEPP-5 injector linac • EBP is routinely used for tuning the beam at the VEPP-5 injector linac • longitudinal distribution of beam density, transverse position of its center of mass, even wake fields observation, single and multibunch regime
Singlebunch regime Offset parameter goes down-> Examples of signals from EBP Collision with intense bunch
Single bunch regime: offset parameter goes down -> Multi bunch regime: offset parameter goes down ->
Pictures with wakes Two bunches Collision with single bunch Wakes start to appear
HFSS E-field plot Probe beam Bunch trajectory
Electron beam probe for circular collider. • Bunch length measurement. • Bunch position monitor. • Measurement of bunch tilt.
Corrector Корректор Cathode Тестирующий пучок MCP Phosphor screen Electron gun Magnetic lenses Photo camera Faraday Cup +6.2 кV 0...-30 кV Scanning device 0...-1.5 кV Bunch Scheme of VEPP-4 electron beam probe.
Interaction region Screen Gun Lenses Scanning system
Simulation for VEPP-4 Longitudinal bunch sigma- 4 cm,transverse bunch sigma - 0.001см. Ne=7,6·109 Ne=14,2·109 Ne=22,8·109 Screen size2x2сm.
Electron Beam Probe for nondestructive diagnostics for better control of the ILC beam emittance of the ILC bunch tilt
Comparisons with simulations help to understand EBP signal Ampl.=0.01 cm Ampl.=0.03 cm Ampl.=0.1 cm Ampl.=0.3 cm
Tilt in the ILC beam y s will result in asymmetrywhich is easy to measure or to minimize
EBP simulation assumptions for ILC Pulsed current density in 200 kV electron gun is about 20 A/cm^2. Collimating diaphragm diameter of 0.1 mm => about 2 mA of probe beam current. It gives for 0.1 mm ILC bunch length (0.5 ps at v=0.7c) 6000 electrons in the close vicinity of ILC bunch. These electrons will form the image (MCP operates in the single electron regime). The probe beam envelope from the gun exit to the screen (horizontal axis (cm)), interaction point is placed 2 cm before the screen. The vertical axis gives the RMS transverse probe beam size in cm (probe beam is round).
EBP for ILC bunch tilt control EBP signal, ideal bunch, no “banana” distortion Bunch with symmetrical tilt: bunch head up (5 microns) in Y bunch tail down (5 microns) in Y (at 1sigma z) The intensity asymmetry between upper left and down left branches of the loops reflects the displacement of the bunch tail. Asymmetry in the right branches reflects the bunch head displacement. The right down branch is more intense – it means the bunch head displaced up. ILC bunch parameters: sz =0.1 mm, sy =1 mm, sx =20 mm, N =0.7*1010 EBP: 200 keV, pulsed, beam current 2 mA, diameter at the gun exit is 0.1 mm, probe beam diameter in the interaction region is about 0.05 mm. Each dot on the screen, which paced 2 cm after the interaction point, corresponds to single electron (about 6000 electrons in the vicinity of ILC bunch).
EBP for ILC bunch tilt control This mode of operation was successfully tested at S-band linac of VEPP-5 injector complex for the bunch length of 4 mm and 0.5mm transverse size Simulation for typical ILC bunch parameters δy = 1 μm δy = 4 μm δy = 8 μm δy = 16 μm Screen images for increasing amplitude of the bunch tilt δy. the bunch head is δy up at +szand the tail is δy down at –sz The asymmetry monotonically increase with increase of beam tilt ILC bunch parameters: sz = 0.1 mm, sx = sy = 10 mm, N =0.7*1010 EBP: 200 keV, pulsed 2 mA, probe beam diameter in the interaction region is about 0.05 mm. About 6000 electrons in the vicinity of ILC bunch.
EBP for ILC bunch tilt control N2 N1 N4 N3 The image asymmetry dependence on the bunch tilting amplitude The error bars show the statistical error 1/sqrt(Nparticles), Nparticles=5000 Measure of asymmetry: Δ1= (N4-N1)/(N4+N1) Δ2 = (N2-N3)/(N2+N3) In this example, the ILC single bunch tilting amplitude (or banana amplitude) can be measured starting from ~ 1 micron ILC bunch parameters: sz = 0.1 mm, sx = sy = 10 mm, N =0.7*1010 EBP: 200 keV, pulsed 2 mA, probe beam diameter in the interaction region is about 0.05 mm. About 6000 electrons in the vicinity of ILC bunch.
Conclusion The EBP based bunch tilt monitor appears to be a useful tool for ILC emittance control Suggestions: more simulation study experimental test, e.g. at ATF
Electron beam probe as a profile monitor for intense proton beam. • Beam profile scanning in 10 ns. • Non destructing control during normal operation. • Profile control on few different turns.
Phosphor screen MCP Photo camera Layout of the proposed EBP for SNS accumulator ring Quadrupole lens Deflector Electron Gun Proton beam 750 600
Simulation of the EBP Probe beam: Energy=75keV, Scan.-parallel, 3rd ,4th quads - off Proton beam: OFF
Simulation of the EBP Probe beam: Energy=75keV, Scan.-parallel, 3rd ,4th quads - off Proton beam: Energy=1GeV Np=1*1013 Transverse size r=1.5cm Round uniform transverse distribution
Simulation of the EBP Probe beam: Energy=75keV, Scan.-parallel, 3rd ,4th quads - off Proton beam: Energy=1GeV Np=2*1013 Transverse size r=1.5cm Round uniform transverse distribution
Simulation of the EBP Probe beam: Energy=75keV, Scan.-parallel, 3rd ,4th quads - off Proton beam: Energy=1GeV Np=5*1013 Transverse size r=1.5cm Round uniform transverse distribution
Simulation of the EBP Probe beam: Energy=75keV, Scan.-parallel, 3rd ,4th quads - off Proton beam: Energy=1GeV Np=1*1014 Transverse size r=1.5cm Round uniform transverse distribution
Proton beam profile reconstruction Probe beam: Energy=75keV, Scan.-parallel, 3rd ,4th quads - off Proton beam: Energy=1GeV Np=1*1013 Transverse size r=1.5cm Round uniform transverse charge distribution Blue line – integrated beam profile under the test, Magenta + square – reconstructed profile