Download
1 / 17
170 likes | 392 Views
Systems of Linear Equations. Lesson 2 – Solving Linear systems graphically. Todays Objectives. Students will be able to solve problems that involve systems of linear equations in two variables graphically and algebraically, including:

E N D
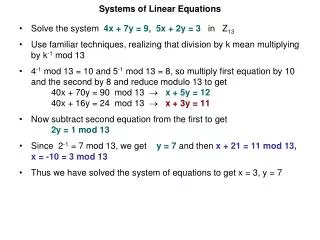
Systems of Linear Equations Lesson 2 – Solving Linear systems graphically
Todays Objectives • Students will be able to solve problems that involve systems of linear equations in two variables graphically and algebraically, including: • Determine and verify the solution of a system of linear equations graphically, with and without technology • Explain the meaning of the point of intersection of a system of linear equations
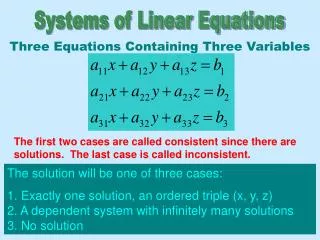
Vocabulary • System of Linear Equations (Linear System): • A system of linear equations is often referred to as a Linear System • A linear system consists of two or more linear equations plotted on the same coordinate plane
Solving linear systems graphically • The solution of a linear system can be estimated by graphing both equations on the same grid. If the two lines intersect, the coordinates (x,y) of the point of intersection are the solution of the linear system. Solution to the system
Solving Linear Systems graphically • Each equation of the following linear system is graphed on the grid. 3x + 2y = -12 We can use the graphs to estimate the solution of the linear system. The set of points that satisfy both equations lie where the two graphs intersect. From the graph, the point of intersection appears to be (-2, -3). • -2x + y = 1
Verifying your estimate • To verify the solution, we check that the coordinates (-2, -3) satisfy both equations: • For each equation, the left side equals the right side. Since x = -2 and y = -3 satisfy each equation these numbers are the solution of the linear system
Your turn • Solve the linear system: • Solution: • Determine the x-intercept and y-intercept of the graph of equation (1). • Both the x and y intercepts are 8. • Write equation (2) in slope y-intercept form. • The slope of the graph of equation (2) is 3/2, and its y-intercept is -7. • Graph each line.
The point of intersection appears to be (6, 2). Verify the solution by substituting x = 6 and y = 2. • 6 + 2 = 8; 8 = 8 • 3(6) – 2(2) = 14; 18 – 4 = 14; 14 = 14 • The left sides equal the right sides, so x = 6, and y = 2 is the solution of the linear system.
Solving a Problem by Graphing a Linear System • One plane left Shanghai at noon to travel 1400 km to Urumqi at an average speed of 400 km/h. Another plane left Urumqi at the same time to travel to Shanghai at an average speed of 350 km/h. A linear system that models this situation is: • where d is the distance in km’s from Shanghai to Urumqi and t is the time in hours since the planes took off.
Solving a Problem by Graphing a Linear System • A) Graph the linear system above. • B) Use the graph to solve this problem: When do the planes pass each other and how far are they from Urumqi? • Solution: • The planes pass each other when they have been travelling for the same time and they are the same distance from Urumqi. • Solve the linear system to determine values of d and t that satisfy both equations. • For the graph of equation (1), the slope is -400 and the vertical intercept is 1400. • For the graph of equation (2), the slope is 350 and the vertical intercept is 0.
A) Graph the linear system d = 1400 – 400t d = 350t Distance (km) Time (h)
B) When do the planes pass each other and how far are they from Urumqi? • The graphs appear to intersect at (1.9, 650); that is, the planes appear to pass each other after travelling for 1.9 hours and at a distance of 650 kilometers from Urumqi. Use the coordinates of the point of intersection to verify the solution. • 400(1.9) = 760 km. So, it will be: (1400 – 760) km, or 640 km’s from Urumqi. The plane travelling from Urumqi to Shanghai travels at 350 km/h, so, in 1.9 hours, its distance from Urumqi will be 350(1.9) km = 665 km. • These times and distances are approximate because these measures cannot be read accurately from the graph. 0.9 hours = 54 minutes. • The planes pass each other after travelling for approximately 1 hour, 54 minutes and when they are approximately 650 km from Urumqi.
Your turn • A) Write a linear system to model this situation: • To visit the Yu Garden in Shanghai, the ticket price is $5 for a student and $9 for an adult. In one hour, 32 people entered the garden and a total of $180 in admission fees was collected. • B) Graph the linear system then solve this problem: • How many students and how many adults visited the garden during this time?
Your turn • Solution: • The linear system is: • Use intercepts to graph each line:
Your turn • Data is discrete so should actually be a series of points • The point of intersection appears to be (27, 5). Verify the solution: • 27 students x $5 = $135 • 5 adults x $9 = $45 • 32 people for $180 • The total number of people is 32 and the total cost is $180, so the solution is correct. 27 students and 5 adults visited the garden.
Homework • Homework: pg. 409-410, # 5-17 • Next class:xiao quiz