Download
1 / 17
170 likes | 280 Views
In this engaging overview, Jennifer Leimberer shares her journey teaching with data in Chicago Public Schools, highlighting successful technology integration in the classroom. Her projects, ranging from analyzing real-time earthquake data to personal family histories, showcase how enabling student access to data fosters analytical skills and deepens understanding. Discover how real-life applications of math and inquiry-based learning motivate students, making education more interactive and effective.

E N D
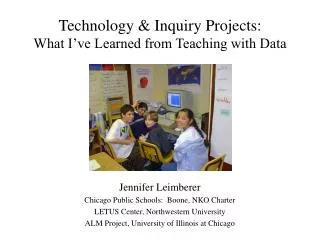
Technology & Inquiry Projects:What I’ve Learned from Teaching with Data Jennifer Leimberer Chicago Public Schools: Boone, NKO Charter LETUS Center, Northwestern University ALM Project, University of Illinois at Chicago
How & Why I Got Computers into My Classroom • I wanted my kids to be analyzing all kinds of DATA! • Real-time earthquake data for science • Primary documents for Social Studies • Images: photographs, images from space • Technology gave my students: • Access to data • Tools to analyze it, and • Ways to reflect and share
What We Did at Boone • 1st grant we wrote: 6 desktop computers • Why the classroom instead of the lab? • Big school = Little access to a lab! (once every 2 weeks?) • Wanted kids to have access when they need it & want it • More access provides proficiency! • Where to put the computers? • Started with them all on one wall – where the power plug was! • Too many kids in too small a space! • Spread computers around the room – lots of extension cords! • 2nd grant: 8 laptops with wireless Internet
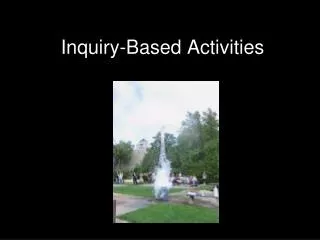
Inquiry Projects • Struggle for Survival • Growth Rate • Hands On Universe • Family History
Example of a project:Struggle for Survival • Students get a database • Finch population data– 5 years in Galapogos • Beak size, weight, field notes • What changes have happened in the population? • Why did some survive & others not? • What I liked about this project • Got them into complex data • Many kinds of data: tables, scatterplots, bar graphs • Kids did not create the graphs, they interpreted them • Focus was on the analysis of data, making explanations
Example of a project:Family History • Story of their family’s immigration or migration • Why they left, what it was like, why they came • Interviewed family members, wrote letters back home • Transcribed interviews – hard! • Scanned letters & annotated them: What did you find? • Studied differences between cultural groups, histories • Internet research on their home countries’ histories • Became our History Fair projects! • What I liked about this project • Students learned to choose good Internet sources • A very personal project, students connected, celebrated cultures • Their interviews became DATA: evidence for later research • Used their Social Studies data ACTIVELY, not passive history
Example of a project:Growth Rate • Every month collected data • Kids decided what to measure at beginning of year • Height, arm span, foot length, etc • Put data into Excel spreadsheet, added to it all year • Every month did a different kind of analysis • What is “typical”? Mean, median, mode, etc • Where did I fit into the data set? • Comparing subsets within the class • Change over time, how kids grow differently (7th – 8th grade!) • Every month took digital photo of themselves • Great affective connection: Personal connection to the math • With pictures, find student that is median height • Could do: scale, ratios (arm span to height)
Example of a project:Hands On Universe • Students get real telescope images • Planets, stars, galaxies, moons • Students request their own images • We requested Jupiter every 60 minutes for one whole night • Kids analyzed the images • Stacked them in software to measure movement • Determined speed of each moon • Which moon is which? What Galileo did • What I liked about this project • Application of math to a real question: Which moon? • Analyzed their own images – like a real astronomer! • Kids had to come up with a real answer
What We’ve Learned About Managing These Projects • Small groups are great because ... • More kids are talking & sharing ideas • Small groups can look for evidence for their own ideas • Kids’ conversation around the data is important! • Differentiate instruction: Address different kids’ needs • What will they turn in after computer time??? • How do I know they were working? what they learned? • Kids need to keep notebooks, screen captures, pictures • Get the data OUT of the computer and INTO the room! • Student create a model, picture, graph, map – make it visible! • Gives teacher a chance to respond, assess, give feedback • Have something to do while others are on the computers!!
What did my students get out of these projects? • Learning to do inquiry • Play with REAL data • More than "just the facts" • They remember the experience • Benefits for high- and low- students