Download
1 / 25
250 likes | 438 Views
Protocol MRS data status 11/27/07 – 12/17/07 Thomas Chong. DW-MRI and MRS to Differentiate Radiation Necrosis and Recurrent Disease in Gliomas. Patient MRS (Magnetic Resonance Spectroscopy) Data.

E N D
Protocol MRS data status 11/27/07 – 12/17/07 Thomas Chong DW-MRI and MRS to Differentiate Radiation Necrosis and Recurrent Disease in Gliomas
Patient MRS (Magnetic Resonance Spectroscopy) Data • Provides data on in vivo chemical composition (via proton NMR) of the lesion and surrounding regions of the brain • 15x15x3 grid of 1cc voxels • Raw data is time response processed to spectrum (ppm) • Characteristic resonance peaks in spectrum correspond to specific compounds (e.g. water, lipids, metabolites). area = ~amount • Focus on Choline/ NAA ratio change for glioma diagnosis
Status Summary 11/27/07 - 12/17/07 • Previous Work • What have I done? team role? • Recap of last summary: Remaining patient #'s 1-10 data manually processed • Knowledge available from the EU INTERPRET project – show and tell of journal paper info
Related Previous Work • Metabolite phantom experiment goal to quantify MRS errors (“registration” or alignment) • T2 FLAIR pulse sequence inappropriate for cuvette phantom • but enough data to show alignment is close enough for our purposes (*) • created dynamic web-accessible MRS database and metabolite amount computation tool (http://web.arizona.edu/mrs_db) • processed all inf/med/sup MRS grid slices for all patients (1-10), inc. validity maps
Low Percentage of “Valid” MRS Spectra -1 • No metabolite amount info obtainable from most data • best, cleanest P1, P2, P5 • Motivated investigation into possible spatial correlations • No clear correlations obvious. Need more data
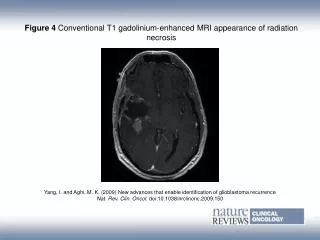
Low Percentage of “Valid” MRS Spectra -2 • Artifacts present in MRS protocol data are consistent with those seen by other researchers • large baseline distortions • exceptionally broadened metabolite peaks • large phase errors • Other observed data corrupting factor • SNR of cho, cre, or naa peaks reduced by large unknown resonance peak • broad non-metabolite peak, or non-constant floor • MRS signal interpretation for tumors recognized as a complicated task – see INTERPRET project (International Network for Pattern Recognition of Tumours Using Magnetic Resonance), a consortium of 10 EU countries [1]
INTERPRET MRS project • Ongoing since 2000, latest developments in 2007 paper • Their goal: “to develop a computer-based decision support tool, that will enable radiologists and other clinicians without special expertise to diagnose and grade brain tumours routinely using magnetic resonance spectroscopy.” Using: • “A large "training set" of data contributed by members of the INTERPRET consortium. • “Automated pattern recognition techniques for tumour classification.
INTERPRET Tumor Classifier Description • INTERPRET DSS (decision support system) • “Easy access to a database of spectra, images and clinical information from 304 validated cases of human brain tumour. • “designed to allow the display of classification plots useful for automating the classification of tumour spectra. • “Currently only one classification plot is provided (suitable for discriminating spectra from low grade gliomas vs Glioblastomas and Metastasis vs Low-grade Meningiomas). • http://www.cogs.susx.ac.uk/users/joshuau/interpret/
INTERPRET MRS project • Developed MRS brain tumor classification software. Pattern recognition based on large training dataset: • 6 MR systems/ 3 diff manufacturers, custom phantom, 3yrs of patient protocol data • SW and data is available for download to aid clinicians not <competing?> researchers • http://www.cogs.susx.ac.uk/users/joshuau/interpret/ • A lot of interesting MRS-tumor related info
INTERPRET MRS project – so? what of it? • Still, how to distinguish artifacts from presence of unwanted/unknown substances? • Common recognition that MRS data interpretation is not easy: • see above name of the big EU project • rigorous process for deciding validity of MRS voxel data in their database entailed up to 3 expert spectrologists.
INTERPRET MRS project – so? what of it? • Useful SNR and WBW measures defined • phantom reference gives info on data variability (it's noisy, based on successive bimonthly meas.) • automated program to check spectrum for WBW < 8Hz, SNR > 10 • Tumor recognition tool does not utilize track of time trend changes in data
INTERPRET Recognition Software • Still research-quality, i.e. use at own risk • Reverse-engineered guess at method: candidate spectrum matched to database-derived mean reference spectrum using neural network and/or (Bayesian) statistical methods. • Can leverage their data & findings as resource to better understand our own data
SV 1H-MRS SHORT echo time spectra of different human brain tumoural pathologies • Normal brain • mean of 22 cases • Glioblastoma • mean of 86 cases • Tate et al. NMR Biomed. 19:411-434, 2006, http://azizu.uab.es/INTERPRET/mean_spectra_images.html
SV 1H-MRS SHORT echo time spectra of different human brain tumoural pathologies • Normal brain • mean of 22 cases • Astrocytoma II • mean of 22 cases • Tate et al. NMR Biomed. 19:411-434, 2006, http://azizu.uab.es/INTERPRET/mean_spectra_images.html
SV 1H-MRS SHORT echo time spectra of different human brain tumoural pathologies • Normal brain • mean of 22 cases • Abscess • mean of 8 cases • Tate et al. NMR Biomed. 19:411-434, 2006, http://azizu.uab.es/INTERPRET/mean_spectra_images.html
Abscess mean of 8 cases v similar to glio. SV 1H-MRS SHORT echo time spectra of different human brain tumoural pathologies • Glioblastoma • mean of 86 cases
SV 1H-MRS SHORT echo time spectra of different human brain tumoural pathologies • Normal brain • mean of 22 cases • Metastasis • mean of 38 cases • Tate et al. NMR Biomed. 19:411-434, 2006, http://azizu.uab.es/INTERPRET/mean_spectra_images.html
SV 1H-MRS SHORT echo time spectra of different human brain tumoural pathologies • Normal brain • mean of 22 cases • Meningioma • mean of 58 cases • Tate et al. NMR Biomed. 19:411-434, 2006, http://azizu.uab.es/INTERPRET/mean_spectra_images.html
New Perspective of Our “Bad” Data • Absence of distinct metabolite peaks prevents calculation of relative amounts and ratios, • ... But others have empirically categorized tumor types based on spectral characteristics. • MRS data we're collecting usable for future studies using different methods
Patient 10, Exam 3446, S16.1 “short” or “long” echo time in our protocol?
Questions • What is water-suppressed spectrum? • non-suppressed spectrum? • What is the water line artifact in spectrum? • Shimming procedure for optimization of field homogeneity? • What does van der Graaf, et al refer to as signal linearity? • WBW (water bandwidth): line width at half max intensity of water resonance in real non-suppressed spectrum - a measure of field homogeneity [1]. significance?
Tasks • Process patient 11 scan data • Answer questions on previous slide • Return to INTERPRET website, continue looking for useful information • How useful was their diagnosis system in the clinical setting? (MRS data alone) • Read source ref for mean brain MRS data: Tate et al. NMR Biomed. 19:411-434, 2006 • Request e-mailed for access to their tool download page and database
Reference • [1] MRS quality assessment in a multicentre study on MRS-based classification of brain tumours. M. van der Graaf, et. al., NMR in Biomedicine, DOI: 10.1002, 2007. • [2] Tate et al. NMR Biomed. 19:411-434, 2006 • http://azizu.uab.es/INTERPRET/mean_spectra_images.html