Download
1 / 19
190 likes | 390 Views
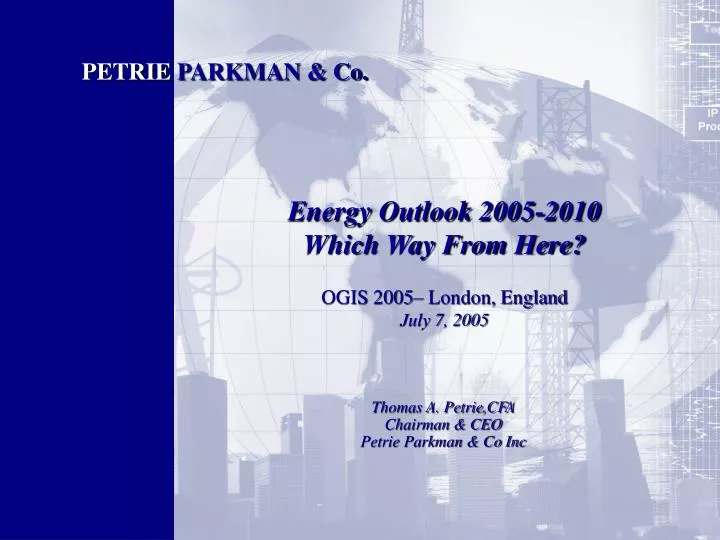
PETRIE PARKMAN & Co. Energy Outlook 2005-2010 Which Way From Here? OGIS 2005– London, England July 7, 2005. Thomas A. Petrie,CFA Chairman & CEO Petrie Parkman & Co Inc. Key Inflationary Measures. US West Texas Intermediate Crude Oil Spot Price. 6/29/2005 Close $57.26.

E N D
PETRIEPARKMAN & Co. Energy Outlook 2005-2010Which Way From Here?OGIS 2005– London, England July 7, 2005 Thomas A. Petrie,CFA Chairman & CEO Petrie Parkman & Co Inc
Key Inflationary Measures US West Texas Intermediate Crude Oil Spot Price 6/29/2005 Close $57.26
World Oil Demand – 1993-2005E YTY percent change 0.7% - 3.8% Avg. 1.9% (millions of barrels per day) Source: Bloomberg & IEA
Per Capita Annual Oil Consumption ∆ Demand ?
OPEC Excess Crude Production Capacity ? Source: International Energy Agency
End of Decade Potential New Production Sources (millions b/d)
Current World Production in Decline (Millions b/d) -19.2
Oil Prices Supermajor Capex Price Assumptions Source: Bloomberg
Natural Gas Prices Source: Bloomberg
F, D & A Costs • Source: Petrie Parkman database; Bloomberg. • Includes APA, APC, BBG, BR, DNR, DVN, EAC, ECA, EOG, EPL, FST, KMG, MHR, NBL, NFX, POG, PPP, PXD, RRC, SFY, SM, SWN, THX, UCL, UPL, WGR, WLL, XEC and XTO.
Commodity Price Trends WTI ( 1995- 2004) Henry Hub ( 1995- 2004)
Commodity Price Trends WTI (2005 – 2010 Projected) Henry Hub (2005 – 2010 Projected)
M&A Trends • After a marked slowdown in 2002 and 2003, corporate M&A activity has accelerated • Eight corporate transactions in 2004 • Three transactions in 2005 YTD • Expectations for sustained higher prices, in combination with rebuilt liquidity have supported an increasingly robust asset market • Companies have limited organic growth opportunities • Capital is available Source: Petrie Parkman transaction database.
Blended Strip (70%/30%) $1.72 Acquisition Pricing vs. Commodity Prices $5.34 Acquisition Pricing Source: Petrie Parkman database; Bloomberg.
Forces Shaping the End-of-Decade Petroleum Landscape • Continued Consolidation via M&A • Maturation of the conventional petroleum resource base • Middle East dynamics / imponderables • Economic growth in China and India • Maturing of Russian Export Inclination • Result: Continued intensified global competition for energy supplies
Inflection Point Thesis Spring 1999 Fall 2003 Summer 2004
Market Environment • Energy back at center stage • Oil and natural gas prices have risen to near record levels • Prices expected to remain strong but significant gap remains between Wall Street & Futures Market • Higher commodity prices support: • Accelerated new technology implementation • Increased recovery from existing fields • Development of new resource plays • Premium returns achievable despite high “cost of entry”
Corporate Transactions 2004 – 2005YTD Source: Petrie Parkman transaction database. Shading represents transactions on which PPC advised.