Download
1 / 34
340 likes | 449 Views
This presentation assesses the use of biomass energy and its impact on the environment and health. It delves into the global consumption trends, carbon emissions, and mitigation strategies, emphasizing the role of biomass in climate change. The discussion includes energy production data, carbon sequestration potentials, and challenges in implementing biomass power solutions. Key topics cover biomass products, carbon emissions, forest sequestration, and energy yield from various biomass sources.

E N D
Biomass, Environment and Health: A Macro Assessment P.R. Shukla
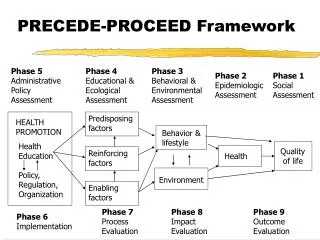
Structure of the Presentation • Biomass Energy Use • Biomass Energy and Environment • Local / Global Environment and Health • Biomass Electricity and Climate Change Mitigation • Ancillary Benefits from mitigation of Local Emissions and Climate Change
Energy Consumption Per Capita Energy Consumption Peta joules 1993 % change since 1973 Mega Joules 1993 % change since 1973 Africa 4 815 76 6 991 0 Europe 552 -14 761 -21 North / Central America 1 825 106 4 130 53 South America 2 748 26 8 888 -17 Asia 9 009 47 2 690 1 Oceania 185 16 6 693 -14 World 19 926 47 3 594 4 Source: WRI (1996) Global Biomass Energy Consumption
Country Energy Consumption Per Capita Energy Consumption Petajoules 1993 % change since 1973 Per Capita 1993 % change since 1973 Bangladesh 277 27 2 401 -20 Bhutan 12 79 7 345 21 Cambodia 54 21 5 560 -11 China 2 018 54 1 687 15 India 2 824 58 3 132 4 Indonesia 1 465 54 7 642 4 Lao PDR 39 35 8 366 -15 Malaysia 90 61 4 686 -3 Biomass Energy in Asian Countries
Country Energy Consumption Per Capita Energy Consumption Petajoules 1993 % change since 1973 Per Capita 1993 % change since 1973 Mongolia 13 0 5 689 -41 Myanmar 193 48 4 324 -4 Nepal 206 88 9 882 12 Pakistan 296 101 2 228 8 Philippines 382 44 5 892 -9 Sri Lanka 89 45 4 996 6 Thailand 526 75 9 141 19 Viet Nam 251 54 3 516 -1 Other 274 - - - Total 9 009 47 2 690 1 Source: WRI, 1996 Biomass Energy in Asian Countries (cont…)
Global GHG Emissions BTC • Fossil Fuels (1990) 6 • 1850 to 1986 Total • Fossil Fuel 195 • Deforestation + Land-use Change 117 • 1980’s (annual) • Fossil Fuel 5.4 • Deforestation + Land-use Change 1.6
Forests and Carbon • Forests cover 3.4 billion hectares of land or 25% of Earth’s surface • Forests store 340 BTC in Vegetation and 620 BTC in Soil • Elimination of deforestation can reduce release of 1.2 BTC of carbon flux each year • 100 BTC carbon can be sequestered over the century by foresting upto a billion hectares
Biomass and Carbon • Unsustainable fuelBiomass use contributes 0.5 BTC each year • Biomass burning emit 22 million tons of methane and 0.2 million tons of NOx • Biomass products annually sequester 1 BTC • Biomass products hold 25 BTC. This amount can be doubled if Biomass substitute other materials • Biomass/ Energy crops can mitigate 1- 4 BTC by the mid-century by substituting fossil fuels
Measure C sequestered Cost Total Cost (BTC) ($/tC) ($ Billion) Forestation 30.6 6 - 8 174 Agro-forestry 0.7 5 3 Regeneration 11.5 - 28.7 2 30 - 60 Slowing 10.8 - 20.8 2 44 - 97 deforestation Total 60 - 87 3.7 - 4.6 280 - 340 Sequestration Potential of Global C (1995-2050)
Biomass Production under Changing Climate Higher Productivity from: • CO2 Fertilization • Higher Precipitation Lower Productivity from: • Pest, Disease, Fire • Species Migration • Change in Soil Nutrients
Biomass for Energy • Availability of Land • Competition with other biomass substitutes • Conversion Technologies • Synfuels • Energy Conversion
1500 1500 1200 1200 Global Average Yield (1987) 900 900 Iowa Corn-Grower's Contest Experimental Plot, Alabama Average for Years 2-6 for Average of Five Experimental Plots, Teaxs (1993-94) Average of Five Experimental Plots, Teaxs (1993-94) Energy Yield (GJ/Hectares/Year) Energy Yield (GJ/Hectares/Year) Record yield (1994), Average Yield (1985-87) Average Yield for Zambia on 10 000 Hectars Average Yield for Zambia on 10 000 Hectars Average Commercial yield on 80 000 Hectares (1986-91) 600 600 Maximum Stand yield (1986-91) High Estimate Low Estimate 300 300 0 0 Biomass Yield From Various Activities Biomass from Sugarcane Alamo Alamo Eucalyptus Eucalyptus Maize, USA Maize, USA Commercial Commercial (Total (Total Swichgrass , , at at Aracruz (Grain+ (Grain+ Forests, Forests, Above ground USA USA Brazil Brazil Stover) Stover) USA USA Biomass) Biomass)
Biomass Energy Options • Synthetic fuels (Synfuels) • Liquids (to replace refined oil products) • Solids like Charcoal (to replace coal) • Biomass Electricity Technologies • Gasifier Engine • Direct Combustion
Institutional Issues for Biomass Power • Market Failure • Weak Market Linkages • Biomass Energy Feedstock System • Financing the Biomass Growers • Risk Coverage • Decentralized Power Generation • Role of the Government
Biomass Power: Implementation Issues • Ownership • Decentralization • Technology Choices • Management of Finances • Identification of Niche Market • Participatory Approach • Monitoring and Control • Dissemination Approach
Climate Change and Health
Health Impacts of Climate Change Direct Health Impacts from: • Exposure to Thermal Extremes • Altered Frequency of Extreme Events • Enhanced Weather Variability Indirect Health Impacts from Changes in: • Vector Borne Diseases • Incidence of Diarrhea, infectious diseases • Sea Level Rise: Water Contamination and dislocation disorders • Mal-nutrition from changes in food supplies
Major Tropical Vector Borne Diseases Disease Population at Impact of Risk (Million) Climate Change Malaria 2400 Highly Likely Schistosomiasis 600 Very Likely Filarisis 1094 Likely Dengue 1800 Very Likely Yellow Fever 450 Very Likely River Blindness 123 Very Likley Guinea Worm 100 Unknown
Biomass Energy: Ancillary (Health) Benefits of Climate Change Mitigation
70 66.36 60 Coal Power Biomass Power 50 40 Emissions (ton) 31.48 30 19.45 20 13.1 10 6.15 2.29 0 S02 NOX Particulate Ancillary Benefits of Biomass Power1 MW Biomass vs. Coal Power Local Pollution (ton/year) Carbon Emission Mitigation/ year 1376 Ton
Pollutant WHO Guidelines Effects Annual Mean 98 Percentile (Micrograms/cum of air) Sulfur Dioxide 40-60 100-150 Exacerbations of respiratory illness (short-term Exposure), Increased respiratory symptoms like chronic bronchitis from long-term exposures. SPM Same as for sulfur dioxide Black Smoke Total SPM 40-60 60-90 100-150 150-230 Combined Exposure to SO2 and SPM may have pulmonary effects Nitrogen Dioxide 1 hour 24 hour 400 - - 150 Effects of lung infection in asthmatics from short-term exposures. Health Effects of Air Pollutants
Year Measurement conditions No.of measurements Particulate Concentration (Micrograms/cum) 1982 Cooking with Biomass 22 15800 Cooking with dung 32 18300 Cooking with charcoal 10 5500 1988 Cooking, measured 0.7 meters from the ceiling. 390 4000-21000 Individual Exposure during cooking (2-5 hrs each day) 1983 in 4 villages 65 6800 1988 in 5 villages 129 4700 1988 in 2 villages 44 3600 1988 in 8 villages 165 3700 Indoor Air Pollution from Cookstoves
Biomass Energy Option for Long-Term Climate Change Mitigation
Stabilization of GHG Concentration Mitigation Options for India Mitigation Target Emissions Gap
Stabilization of GHG Concentration Global Mitigation Options Mitigation Target
Biomass Energy has an important role in meeting the objectives of UNFCCC • Biomass production will be impacted by climate change • Biomass Energy offer direct health benefits as a substitute for fossil energy • Biomass energy as can contribute to health benefits as climate change mitigation option • Biomass energy links climate change and sustainable development Conclusions