Download
1 / 20
200 likes | 342 Views
Prospects and Principles for Probing the Problematic Propulsion. Optimization of large-scale surveys to probe the DE. David Parkinson University of Sussex. Outline. Surveys Figure-of-merit Optimisation WFMOS Conclusions. Dark Energy. The Universe is accelerating, but why…

E N D
Prospects and Principles for Probing the Problematic Propulsion Optimization of large-scale surveys to probe the DE David Parkinson University of Sussex
Outline • Surveys • Figure-of-merit • Optimisation • WFMOS • Conclusions
Dark Energy • The Universe is accelerating, but why… • Cosmological Constant () • Field (quintessence etc) • Modification of gravity at large scales • Other.. • No evidence for time variation in the dark energy, but errors are very large, so model space is wide open..
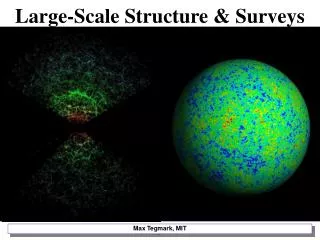
Probing the Dark Energy • Measuring distances • Standard candles (Sn-Ia) • Standard rulers (Baryonic oscillations) • Structure formation • Weak gravitational lensing • Gravitational potential (ISW)
Future Surveys • Supernovae - repeated imaging with spectroscopic follow-up • Current: SNLS, ESSENCE, SDSS-II • Next gen: Pan-STARRS, DES • 3rd gen: LSST, JDEM, DUNE • Baryonic Acoustic Oscillations - large scale redshift survey • Current: WiggleZ, SDSS-II • Next gen: APO-SDSS, DES(photo-z), HETDEX (high-z), WFMOS, Hydrogen Sphere Survey (radio) • 3rd gen: LSST, JDEM, SKA (radio) • Weak Lensing - large scale, high quality imaging survey • Next gen: DES, Pan-STARRS, HSC • 3rd gen: DUNE, JDEM, LSST
Survey Design • How do we optimize a survey to maximize its performance in constraining the dark energy? • What survey strategy should we take; ie. • What type of objects should we target? • At which redshifts should we take measurements? • Should it survey a wide area at low redshift, or a small number of thin ‘pencil beam’ surveys going to a greater depth (or a mixture of the two)? • And how do we quantify the performance of the survey?
Figure of Merit • Constraining equation of state, w, and its evolution in time is seen as the primary goal. • The DE Task force created a Figure of Merit to compare different surveys and approaches • It is the inverse of the 95% confidence contour in the w0, wa plane
Effectiveness • The errors on w (and so the FoM) of a survey depends on the fiducial cosmology. • And even the conclusions that you draw from the data may change with the cosmology
Figures of Merit • Fisher Matrix (DETF Figure of Merit) • Assumes Gaussianity and a specific cosmology • Integrated Parameter Survey Optimisation (Bassett 2004; Bassett, Parkinson and Nichol 2005) • The Figure of Merit is the integral of the performance (I) over the cosmological parameters. • Bayes Factor (Mukherjee et al 2006) • Compares probabilities of Lambda and evolving DE model
Select Random Survey Geometry Compute FoM Compare to previous survey Find Survey Geometry to Maximise FoM Optimization Process
Sampling vs. the Lever Arm • Effectiveness is a trade off between • Sampling, e.g. the matter power spectrum in BAO surveys, proportional to the survey volume • The lever arm, e.g. the deepness of survey in magnitude, proportional to the exposure time • Time is the limiting factor, so deeper surveys cover less area, and vice versa.
Measurement error Go to zero as z0 “Lever-Arm” • Low-z surveys only really measure expansion rate today (H0). To measure acceleration (and rate of change of acceleration), need long baseline • Example using Fisher matrix: measurement of Hubble parameter at redshift z to constrain DE parameters w0 and wa
WFMOS with Bassett, Blake, Glazebrook, Kunz, Nichol and WFMOS consortium • WFMOS: • Wide-Field (1.5o aperture diameter), • Fiber-Fed Optical (“Echidna”-style fiber-optic focal plane) • Multi-Object (Over 20,000 astronomical spectra per night) • Spectrograph (Moderate to high resolution (R=1000-40,000)) • Concept stage; design studies for Gemini underway. • Objective: to detect Baryonic Oscillations in the large-scale structure and so conduct an independent probe of the dark energy.
Survey Properties • Time: split between the high and low redshift regions. Total time = 1500 hours (expected observing time over three years). • Area: different areas assigned to high and low redshift regions. • Number of pointings: generated from area and time. • Redshift binning: Redshift regions broken down into a number of bins.
Exposure Time & Area • Line emission “active” galaxies (blue) favoured over continuum “passive” galaxies (red) for both low and high redshift bins • Cannot constrain high redshift bin, because does not contribute to FoM
Single bin: z vs. area • Input galaxy population affects optimal survey • Blue galaxies favour higher redshift bin (z~1) than fiducial (z=0.9), while red galaxies favour lower (z~0.8) • Optimisation seeks to maximise area and minimise exposure time • Single bin at low redshift • total time = 1500 hrs • redshift range and area allowed to vary
Improvement • Optimising the survey increases the FoM by a factor of ~4, decreasing the ellipse size by 50% and the error on each parameter by 40%
Number of fibres • Can also use technique to optimise instrument design parameters, such as number of fibres • For single line emission bin at low redshift, FoM asymptotes to maximum value at ~10,000 fibres.
Efficiency of fibres • Although 10,000 fibres is the best for line emission, it is not efficient as it returns only 60% usable redshifts • Instead should look at most efficient use of fibres, which peaks around 2000 fibres • Medium best: 3000-4000 fibres
Conclusions • Designing galaxy surveys for the DE is a trade off between volume (to minimize sampling errors) and depth (to extend a larger “lever-arm”) • This trade off is dependent on the nature of the instrument • A FoM that targets only the DE parameters will naturally prefer a survey centered at z~1. • But the survey parameters are not highly peaked in FoM, so there is some flexibility in terms of the design.