Download
1 / 28
290 likes | 341 Views
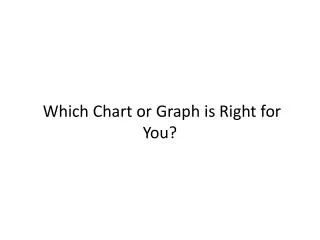
Discover the best chart type for your data visualization needs. Learn when to use bar charts, line charts, pie charts, maps, scatter plots, and Gantt charts effectively.

E N D
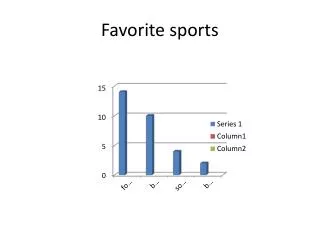
Bar charts Bar charts are one of the most common ways to visualize data. Why? It’s quick to compare information, revealing highs and lows at a glance. Bar charts are especially effective when you have numerical data that splits nicely into different categories so you can quickly see trends within your data
Figure 1: Tell stories with bar charts Are film sequels profitable? In this example of a bar chart, you quickly get a sense of how profitable sequels are for box office franchises
Line Line charts are right up there with bars and pies as one of the most frequently used chart types. Line charts connect individual numeric data points. The result is a simple, straightforward way to visualize a sequence of values. Their primary use is to display trends over a period of time. When to use line charts: Viewing trends in data over time. Examples: stock price change over a five-year period, website page views during a month, revenue growth by quarter.
These two line charts illuminate the increasing popularity of “Black Friday” as an epic event in the United States. It’s quick to see that Thanksgiving lost ground to the popular shopping period in 2008.
Line charts are the most effective way to show change over time. In this case, GE’s stock performance over a one-year period is joined with trading volume during the same time frame. At a glance you can tell there were two significant events, one resulting in a sell-off and the other a gain for shareholders Video
Pie Pie charts should be used to show relative proportions – or percentages – of information. That’s it. Despite this narrow recommendation for when to use pies, they are made with abandon. As a result, they are the most commonly mis-used chart type. If you are trying to compare data, use bars or stacked bars. Don’t ask your viewer to translate pie wedges into relevant data or compare one pie to another. Key points from your data will be missed and the viewer has to work too hard. Limit pie wedges to six. If you have more than six proportions to communicate, consider a bar chart. It becomes too hard to meaningfully interpret the pie pieces when the number of wedges gets too high. When to use pie charts: Showing proportions. Examples: percentage of budget spent on different departments, response categories from a survey, breakdown of how Americans spend their leisure time
Overlay pies on maps. Pies can be an interesting way to highlight geographical trends in your data. If you choose to use this technique, use pies with only a couple of wedges to keep it easy to understand. Using pie charts on this map shows the distribution of oil rigs on land vs. offshore in Europe.
Map When you have any kind of location data – whether it’s postal codes, state abbreviations, country names, or your own custom geocoding – you’ve got to see your data on a map. You wouldn’t leave home to find a new restaurant without a map (or a GPS anyway), would you? So demand the same informative view from your data. When to use maps: Showing geocoded data. Examples: Insurance claims by state, product export destinations by country, car accidents by zip code, custom sales territories
Provide street-level data on a map Maps are a powerful way to visualize data. In this visualization you can zero in on every LEED certified building in the United States based on their street address. Select any state or city to find the greenest buildings in that area
Scatter plot Looking to dig a little deeper into some data, but not quite sure how – or if – different pieces of information relate? Scatter plots are an effective way to give you a sense of trends, concentrations and outliers that will direct you to where you want to focus your investigation efforts further. When to use scatter plots: Investigating the relationship between different variables. Examples: Male versus female likelihood of having lung cancer at different ages, technology early adopters’ and laggards’ purchase patterns of smart phones, shipping costs of different product categories to different regions
Can you spot the fraud? Using scatter plots is a quick, effective way to spot outliers that might warrant further investigation. By creating this interactive scatter plot, an insurance investigator can quickly evaluate where they might have fraudulent activity.
Gantt Hitting deadlines is paramount to a project’s success. Seeing what needs to be accomplished – and by when – is essential to make this happen. This is where a Gantt chart comes in. Gantt charts excel at illustrating the start and finish dates elements of a project. While most associate Gantt charts with project management, they can be used to understand how other things such as people or machines vary over time. You could use a Gantt, for example, to do resource planning to see how long it took people to hit specific milestones, such as a certification level, and how that was distributed over time. When to use Gantt charts: Displaying a project schedule. Examples: illustrating key deliverables, owners, and deadlines. Showing other things in use over time. Examples: duration of a machine’s use, availability of players on a team.
Who served the longest? With a quick glance, this Gantt chart lets you know which U.S. senator held office the longest and which side of the aisle they represented. Select the visualization and use the drop down menu to see criteria such as party
Bubble Bubbles are not their own type of visualization but instead should be viewed as a technique to accentuate data on scatter plots or maps. People are drawn to using bubbles because the varied size of circles provides meaning about the data. When bubbles vary by color as well as size the impact is magnified. When to use bubbles: Showing the concentration of data along two axes. Examples: sales concentration by product and geography, class attendance by department and time of day. When to use bubbles: Showing the concentration of data along two axes. Examples: sales concentration by product and geography, class attendance by department and time of day.
Histogram Use histograms when you want to see how your data are distributed across groups. Say, for example, that you’ve got 100 pumpkins and you want to know how many weigh 2 pounds or less, 3-5 pounds, 6-10 pounds, etc. By grouping your data into these categories then plotting them with vertical bars along an axis, you will see the distribution of your pumpkins according to weight. When to use histograms: Understanding the distribution of your data. Examples: Number of customers by company size, student performance on an exam, frequency of a product defect.
Which houses are selling? This histogram shows which houses are seeing the most sales in a month. Explore how the histogram changes when you select a different month, county, or distress level.
Bullet When you’ve got a goal and want to track progress against it, bullet charts are for you. A bullet graph is a variation of a bar chart. It was designed to replace dashboard gauges, meters and thermometers. Why? Because those images typically don’t display sufficient information and require valuable dashboard real estate. Bullet graphs compare a primary measure (let’s say, year-to-date revenue) to one or more other measures (such as annual revenue target) and presents this in the context of defined performance metrics (sales quota, for example). Looking at a bullet graph tells you instantly how the primary measure is performing against overall goals (such as how close a sales rep is to achieving her annual quota). When to use bullet graphs: Evaluating performance of a metric against a goal. Examples: sales quota assessment, actual spending vs. budget, performance spectrum (great/good/poor).
Have you hit your quota? Tracking a sales team’s progression to hitting its quota is a critical element to managing success. In this quota dashboard, a sales manager can quickly select to view her team’s performance by quota percentage or sales amount as well as zero in on regional achievement
Heat map Heat maps are a great way to compare data across two categories using color. The effect is to quickly see where the intersection of the categories is strongest and weakest. When to use heat maps: Showing the relationship between two factors. Examples: segmentation analysis of target market, product adoption across regions, sales leads by individual rep.
Who buys the most books? In this market segmentation analysis, the heat map reveals a new campaign idea. High-income households of people in their sixties buy children’s books
Highlight table Highlight tables take heat maps one step further. In addition to showing how data intersects by using color, highlight tables add a number on top to provide additional detail.
Highlight table shows spending difference This highlight table compares two 2012 budget proposals for the U.S.