Download
1 / 10
100 likes | 207 Views
Analysis of MiniBooNE data focused on beam intensity variations and bunch structure before and after a shutdown. Early 2003 data comparisons and frequency spectrum evaluations provide insights into changes post-shutdown.

E N D
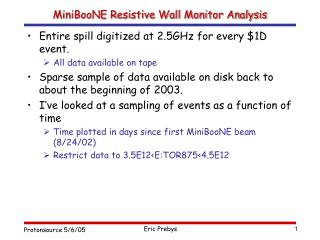
MiniBooNE Resistive Wall Monitor Analysis • Entire spill digitized at 2.5GHz for every $1D event. • All data available on tape • Sparse sample of data available on disk back to about the beginning of 2003. • I’ve looked at a sampling of events as a function of time • Time plotted in days since first MiniBooNE beam (8/24/02) • Restrict data to 3.5E12<E:TOR875<4.5E12
Compare Data Before and after last shutdown Just Before Shutdown Most Recent
~30 overlayed events before and after shutdown Before shutdown Recent
Frequency Spectrum, before and after shutdown Less coupled-bunch in new data
Conclusions • Something has changed since the shutdown • Bunch structure generally “messier” • Not sure why • Should monitor this more closely in the future.