Download
1 / 16
160 likes | 181 Views
What’s Up with the Weather?. A Data Analysis Project 2005-2006 Math and Science join hands. Standards and Objectives. Standards: Students pose questions and collect, organize, and represent data to answer those questions Students interpret data using methods of exploratory data analysis.

E N D
What’s Up with the Weather? A Data Analysis Project 2005-2006 Math and Science join hands
Standards and Objectives Standards: • Students pose questions and collect, organize, and represent data to answer those questions • Students interpret data using methods of exploratory data analysis Benchmarks: • Organize collections of data • Create and use various representations of data • Analyze and interpret relationships between variables (e.g. scatterplots) Objective: Students will graph and compare different aspects of the weather to discover trends and/or relationships within the data provided by the weather station.
Standards Part 2 (HCPS III) • Benchmark SC.ES.1.5 Communicate the components of a scientific investigation, using appropriate techniques • Benchmark SC.ES.2.4 Describe technologies used to collect information about the universe • Benchmark SC.ES.8.7 Describe climate and weather patterns associated with certain geographic locations and features
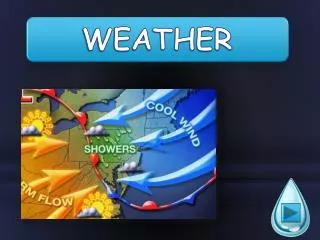
The KMS weather station is mounted on J-building. It has been recording daily weather data since September 2003. The data includes high, low, and mean temperatures times of highs and lows amount of rainfall wind speed wind direction KMS Weather Station
Weather Data • Data collected by the weather station can be found on Mr. B’s website
Step 1: Input the Data • Download the data – it is already in Excel. • Select the time span you want to analyze. • Choose the data you are going to analyze and delete the other data columns.
What to Graph • Group A Sept 10-03-Mar 31-04 Temp-H/L/mean • Group B April 01-04-Aug31-04 Temp-H/L/mean • Group C Sept 01-04-Mar 31-05 Temp-H/L/mean • Group D April 01-05-Aug 31-05 Temp-H/L/mean • Group E Sept 01-05-Dec 31-05 Temp-H/L/mean • Group F Sept 10-03-Dec 31-05 Temperature • Group G Sept 10-03-Dec 31-05 Rain-Avg Wind • To make a second graph – choose a different measurement (Rain – Wind)
Step 2: Graph the Data • Highlight the information you want to graph. • Select “Insert”, “Chart”, “New Worksheet”. • Select the type of graph you want to make. (X-Y Scatter is the recommended) • Click “Next”
Title Describes the graph: WHAT? WHEN? WHERE? Axes Labels Describes the type of data AND the units of measure. Remember: X-axis: horizontal Y-axis: vertical Step 3: Label the Graph
Title describes What? When? Where? Axes labels tell what kind of data AND units of measure
Step 4: Format the Graph • To format your graph, double click on the item you want to change (lines, background, title font/size, etc). • Guidelines: • Titles, labels, and lines should be clear and easy to read. • Select colors and patterns that will make the data stand out. • Be sure that your design isn’t too distracting. Remember that the DATA is what’s important.
Titles and labels easy to read Data stands out Design is not overly distracting
Step 5: Analyze the Graph • Look for patterns, trends, or relationships you see in the lines. • What does this mean about the weather/ temperature? Ex. 1: On January 3, 2005, the three lines are relatively close together. This means the temperature was fairly stable throughout the day. It didn’t get really hot nor really cold. Ex. 3: The mean temperature line is flat. This means that the average temperature in the first five days of January was about the same each day. Ex. 2: The high temperature line goes up and down. This means that on some days, the temperature got hot during at least one point in the day. On other days, it didn’t get as hot.
Step 6: Summarize your findings • Write a conclusion in paragraph form. Briefly restate what you found in your analysis. • Answer this question: Do you think the patterns you found will continue through 2006? Why or why not?
Grading Rubric • Write Up • Data Analysis – Graphing • Beauty