Download
1 / 18
180 likes | 293 Views
This article explores the comparison of two groups using statistical tests, specifically focusing on t-tests and matched pairs t-tests. We detail the rationale behind testing whether group means are significantly different, illustrated with a practical example involving educational methods. Learn how to set up hypotheses, calculate test statistics, and interpret results while considering assumptions such as homogeneity of variance and independence of observations. Gain insights into the power of these tests and their implications in real-world scenarios, enhancing your statistical toolkit.

E N D
Comparing Two Groups Statistics 2126
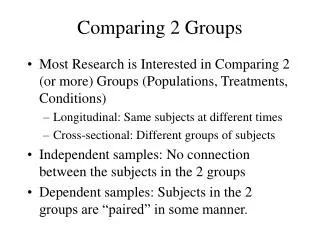
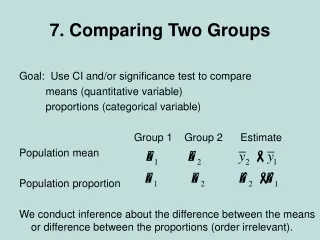
So far.. • We have been able to compare a sample mean to a population mean • z test • t test • Often times though we have two groups to compare • Is Group 1 different from Group 2
Matched pairs or correlated t test • AKA dependent sample t test • When subjects are matched on a variable or are used as their own controls, a sort of before and after thing if you will • Be very careful with this • But it is way powerful and easy to do
And now for the decision • t(6) = 2.447 • tobt = 2.95 • Reject H0 • Our IQ course works!!
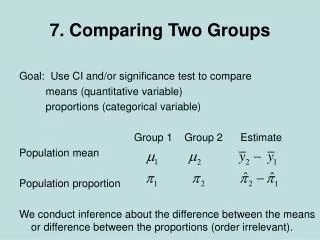
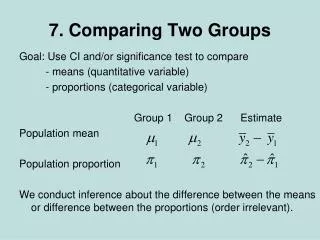
Two sample problems • While is is useful to know how to compare a sample mean to a population mean and check for significance it is not all that common • We rarely know μ • Sometimes we do • IQ • Differences • Theoretical values
The much more common question is… • Does one group differ from another? • Let’s say we had two classes with different teaching methods • Is there an effect of teaching method?
Our hypotheses • Are the two classes different? • H0μ1 = μ2 • HAμ1 ≠ μ2 • Or we could restate them like this: • H0μ1 - μ2 = 0 • HAμ1 ≠ μ2 ≠ 0
Let’s go back to the original t formula Statistic ↓ H0 ↓ ← Error
Now about that error… • We cannot just add the values of s for each group • They must be weighted
Degrees of freedom • With a one sample t test we lose one degree of freedom • Because we calculated one standard deviation • Here was have calculated 2 • So we lose 2 df • In our case we have 99 df
conclusions • All t tests are based on the same formula • Keep the assumptions in mind • SRS • Homogeneity of variance • Independence of observations