Download
1 / 53
680 likes | 1.57k Views
Principles and Applications of Ellipsometry. Dr. Joe Keddie University of Surrey j.keddie@surrey.ac.uk. Modern Techniques for Characterising Dispersions and Surfaces 17 November, 2004. What Ellipsometry Reveals.

E N D
Principles and Applications ofEllipsometry Dr. Joe Keddie University of Surrey j.keddie@surrey.ac.uk Modern Techniques for Characterising Dispersions and Surfaces 17 November, 2004
What Ellipsometry Reveals • Sensitive to the complex refractive index depth profile (z direction) z nfilm n nsub z
Spectroscopic Ellipsometer at the University of Surrey q analyser polariser Wavelength range: 200 nm to 1200 nm Angular control
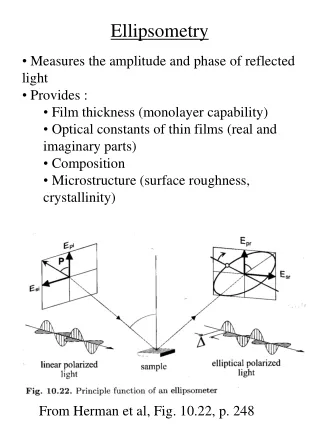
Advantages of Ellipsometry • Fast (measurements in seconds) and non-invasive. • Applicable to any interface: solid/liquid; liquid/air; solid/solid, etc. (but must be able to obtain specular reflection). • Measures the changes in both the amplitude (intensity) and the phase of polarised light after reflection. Hence, it is highly sensitive. • Detects changes in thickness of 0.1 nm and in index of 0.001. J.L. Keddie, Curr Opin. Coll. Interf. Sci., 6 (2001) 102-10
Applications of Ellipsometry • Thin films: Thickness, thermal expansivity, solvent loss and relaxation, swelling, crosslink density. • Adsorption: any small molecule, e.g. proteins, surfactants, and amphiphilic polymers, at any interface (solid/liquid; air/liquid; liquid/liquid). • Bulk: complex refractive index (n + ik), void content, surface roughness, composition, density, and structure, e.g. crystalline vs. glassy and solid vs. liquid.
System Requirements Key point: There must be specular reflection from the interface(s) of interest. • Planar across the footprint of the light beam, typically a few mm. • Smooth enough to achieve specular reflection. • Reflective: a higher contrast in refractive index leads to greater reflectivity. • Not too thick: non-transparent films must be less than the penetration depth of light, z:
Ellipsometry parameters Central Equation of Ellipsometry Rp and Rs are Fresnel reflection coefficients p = in the plane of reflection s = perpendicular to plane of reflection
p n1 = 1.33 qo s qo Fresnel Reflection Coefficients o no n1 1 Snell’s Law:
qB Brewster Angle: Ellipsometry Spectra for a Single Sharp Interface 1.4 200 4 Index n1 = 1.33 y () D() 51 0 no=1.0 0 1.0 -10 10 0 51 55 Angle of Incidence () Vertical Distance (nm)
1.5 4 200 Index y () D() 1.0 0 -10 15 55 Vertical Distance (nm) Angle of Incidence () Ellipsometry Spectra for a Single Index Step at an Interface 0 51 D= 90° at Brewster angle High Sensitivity
Circular Ap= As dp - ds= 90° Linear Ap As dp - ds= 0° Types of Polarised Light Elliptical Ap As dp - ds0° • • •
Definition of Ellipsometry Parameters Ellipsometry parameters Physical Meaning of Parameters: y = ratio of the amplitudes (A) before and after reflection i = initial amplitude; r = reflected amplitude D = change in the phase difference (d) caused by reflection
If the ellipsometry parameters, y and D, are known, then the central equation of ellipsometry can be inverted to determine the complexrefractive index, . = ellipticity (complex, except when D = 0 or 180°) Exact Solution of Ellipsometry Equations for a Semi- Substrate q no
• Rotating Polariser Light Source Rotating Polariser Sample Analyser Detector • Rotating Analyser Light Source Polariser Sample Rotating Analyser Detector Types of Ellipsometer Null Ellipsometer (uses circularly polarised light) • Light Source Linear Polariser Compensator Sample Analyser Detector Rotating Element (uses linearly polarised light)
Measure y and D for various q and/or l Adjust model to improve the fit Compare Predict y and D using a physical model and calculating Fresnel coefficients. Approach to Data Analysis In most cases, the data cannot be inverted to determine all of the unknown parameters, and therefore this approach is used:
Thin Film Analysis Flexible displays Printing inks Optical Coatings Photoresists
Fresnel Coefficients for Film on a Substrate o no 0 1 d 1 2
Polymer Thin Films on Polymer Substrates 20 648 nm silicone film on poly(carbonate) substrate B. Parbhoo et al., Surf. Interf. Anal., 29 (2000) 341-5.
Infrared Ellipsometry of Thick Coatings 10 mm PDMS coating on Si Fringe spacings are inversely related to thickness
Bare Si OTS layer 70° 75° 80° D.A. Styrkas et al, J. Appl. Phys., 85 (1999) 868-75 Sensitivity of Ellipsometry Monolayers of “OTS” (Octadecyl trichlorosilane) h Si Data analysis reveals that the OTS layer thickness is 2.5 nm.
Thin Film Relaxation Ellipsometry scans of a PMMA thin film immediately after spin-casting Data obtained at four different wavelengths D H. Richardson et al., Eur. Phys. J. E Suppl. 1, 12 (2003) p. 87-91. Also, to appear in Phys Rev E.
h Results of Data Analysis: t Slow solvent loss over more than 1 hr. n t
Swelling of Polymer Thin Film in Solvent 39 nm PS thin film on Si exposed to MEK in water. Data obtained every 2 sec. l= 450 nm;q= 72 Solvent added
Melt Glass Tg Determining the Glass Transition Temperature PS on Si ho ~ 100 nm Keddie et al., Europhys. Lett. 27 (1994) 59-64
Solvent Loss from Polymer Thin Films PMMA film spin-cast from toluene Quartz crystal microbalance H. Richardson et al., Eur. Phys. J. E,12 (2003) 437-41.
n1 no d Brewster Angle: Sensitivity to Interfacial Layers PS PMMA d
Away from the Brewster Angle q= 70° = 633 nm Poor Sensitivity! d = 10 nm d = 0 nm
Near the Brewster Angle q =qB= 46.8° = 633 nm Excellent Sensitivity! d = 10 nm d = 0 nm
Adsorption at Solid/Liquid Interfaces • For thin films < ~20 nm, there is strong correlation between thickness (dlayer) and refractive index (nlayer). Difficult to determine both simultaneously. • Independent measurements can be made of how n of a solution varies with concentration: dnsoln/dc. The neat liquid has an index of nliq. • The total amount adsorbed at an interface, G, is related to the product of dlayer and nlayer :
Refractive Index of Solutions nsoln A typical value of dn/dc is 0.18 cm3 g-1. 1.37 • • 1.35 • • • • 1.33 water 0.2 0.1 c (g cm-3)
Amphiphilic Poly(Electrolyte) Permanently hydrophilic block Amphiphilic block Positively charged De-protonation at high pH D. Styrkas et al., Langmuir, 16 (2000) 5980-86
Ellipsometry Liquid Cell q= 72° y D l l Low (; pH = 2.7) and high (; pH = 9.2) values of pH. Adsorbed amount varies from ~1 to ~4 mg m-2.
Amphiphilic Poly(Electrolyte) Adsorption at Solid/Liquid Interfaces Adsorption is “tuneable” with pH Evidence for unimer vs. micellar adsorption Copolymer composition, charge and molecular architecture can be correlated with the total adsorbed amount. D. Styrkas et al., Langmuir, 16 (2000) 5980-86
Surfactant Adsorption at Polymer/Water Interface Penta(ethylene glycol) monododecyl ether [C12E5] adsorbed at the interface between PMMA and water 2 x cmc 1/50 x cmc q= 75° Gvariesfrom 1 to 3.5 x 10⁻⁶ mol m-2 V.A. Gilchrist et al., Langmuir16 (2000) 740-48
1 g dm-3 aq. soln. water Protein Adsorption at Polymer/Water Interface Lysozyme adsorbed onto a phosphorylcholine polymer thin film on Si q= 75° pH = 7 E.F. Murphy et al., Biomaterials20 (1999) 1501-11
Dielectric/Optical Constants of Transparent Dielectric Materials UV Near IR If transparent: k = 0
Dielectric/Optical Constants of Transparent Dielectric Materials Cauchy equation describes the wavelength dependence of n UV Near IR Equation reduces the number of “unknowns” to 2 or 3!
Interference fringes 5 6 4 3 2 1 Chemical Sensitivity from IR SE 14 mm silicone (PDMS) coating on Si The SiH stretching mode (1) is apparent in the spectrum at about 2150 cm-1 as indicated with the heavy red line. The other bands are the asymmetric (2: 1400 cm-1) and symmetric (3: 1250 cm-1) CH3 deformations, Si-O-Si stretch (4: 1000 – 1100 cm-1), CH3 rock/Si-C stretch (5: 750 - 870 cm-1), asymmetric CH3 stretch (6: 2954 cm-1). T.R.E. Simpson et al., Polymer 44 (2003) 4829-38.
Chemical Changes Crosslinking reaction over time at 80 °C SiH peak The times shown are 0 (), 1.2 (), 3.7 (), 4.9 (), 13.7 (), and 182 min. (). The lines show the best fit to the data using an EMA model, corresponding to 0%, 19%, 29%, 42%, 64% and 100% completion (in chronological order). T.R.E. Simpson et al., Polymer 44 (2003) 4829-38.
Effective Medium Approximations Often a material is a blend of two “substances”, such as poly(vinyl alcohol) (nA = 1.50) and water (nB = 1.33) or PMMA (nA = 1.48) and air (nB = 1.0). A B An effective medium approximation enables us to calculate the refractive index of a composite based on the volume fractions and refractive indices of its components, nA and nB.
Effective Medium Approximation (EMA) • For a composite consisting of substances B dispersed in substance A , the refractive index, n, is not a simple average of the indices of A and B: nA and nB. • Usually, nA and nB can be measured separately or determined from the literature. • Ellipsometry measurement of n can be used to find the volume fraction of component B, fB:
Surface Roughness Surface roughness can be described as being a layer that consists of 50 vol.% air and 50 vol.% of the substrate. n=1 nrough nsubst An EMA model can be applied to calculate the refractive index of the rough surface layer, nrough.
Structure of Latex Films Surface roughness 5 mm x 5 mm Interparticle voids The concentration of air voids and the surface roughness of a latex film can be independently determined.
Levelling and Coalescence Fresh film: 7.5 vol.% voids and 20 nm surface roughness 36 hr. old film with 4.2 vol.% voids and 10 nm roughness Scans made near the Brewster angle to obtain best sensitivity A. Tzitzinou et al., Macromolecules, 32 (1999) 136-44.
Gradual particle coalescence <n> No coalescence - air voids develop t Latex Film Formation A. Tzitzinou et al., Macromolecules, 32 (1999) 136-44.
Hydrophilic Poly(acrylate) W.-L. Chen et al., Macromolecules, 32 (1999) 136-44.