Download

1 / 28
280 likes | 467 Views
Simulation of synthetic series through stochastic processes. Alberto Montanari University of Bologna. Stochastic simulation. Stochastic (random) processes can be used for directly generating river flow data.

E N D
Simulation of synthetic series through stochastic processes Alberto Montanari University of Bologna
Stochastic simulation • Stochastic (random) processes can be used for directly generating river flow data. • Realisation of a stochastic process: a time series that is a random outcome from the process. • Statistics of the synthetic series are similar to those of the observed time series. • Be careful: nature is not stochastic. It follows just one trajectory which is not random. It is our assumption to describe unknown trajectories, which we cannot describe deterministically, with a random process
Some basic concepts of statistics and probability • Statistics is the science of the collection, organization, and interpretation data. It deals with all aspects of this, including the planning of data collection in terms of the design of surveys and experiments (from Wikipedia). • Probability is a way of expressing knowledge or belief that an event will occur or has occurred. Probability theory is used in statistics. • The word probability does not have a consistent direct definition.
Some basic concepts of statistics and probability There are two broad categories of probability interpretations: • Frequentists talk about probabilities only when dealing with experiments that are random and well-defined. The probability of a random event denotes the relative frequency of occurrence of an experiment's outcome, when repeating the experiment. Frequentists consider probability to be the relative frequency "in the long run" of outcomes. • Bayesians assign probabilities to any statement whatsoever, even when no random process is involved. Probability, for a Bayesian, is a way to represent an individual's degree of belief in a statement, or an objective degree of rational belief, given the evidence.
Some basic concepts of statistics and probability Kolmogorov axioms of probability: • Probability lies in the range [0,1]. • Probability of the certain event is 1; probability of the impossible event is 0. • Pr (A U B U C U etc) = Pr(A) + Pr(B) + Pr(C) + Pr (etc) where A, B, C and etc are mutually exclusive. Engineeristic interpretation: probability expresses the likelihood of an event with a measure varying between 0 and 1. Random variable: numerical description of the outcome from an experiment.
Some basic concepts of statistics and probability Frequentist interpretation: define an experiment and estimate probability of each outcome by computing its frequency in the long run. Be careful: to understand the differences between Bayesian and frequentist probability is not easy. Basically, the first does not require the definition of a formal experiment and therefore allows for subjective estimation of probability. The two interpretations are not mutually exclusive; they should reach the same conclusions when applied to well defined experiments (well defined accordingly to frequentist’s interpretation).
Some basic concepts of statistics and probability Probability distribution of a random variable X, with outcome x. Associates to each x its probability (when the variable is discrete) or the probability of each value of X to fall within a certain range (when the variable is continuous). Probability distributions have different shapes and depends on one or more parameters. Example: Gaussian probability distribution (or Normal distribution). Central limit theorem.
Some basic concepts of statistics and probability When the random variable is discrete, the meaning of probability distribution is clear: it gives the probability P(X=x) For continuous variables the physical interpretation is more difficult, because the probability of getting each individual value of a real random variable is infinitesimally small (practically zero). Therefore we may refer to the probability P(X=x) as the probability for X to fall in a infinitesimally small range around x. Probability density of X to assume a individual value x within a certain range Dx: can be approximately computed by estimating the probability of X to fall in Dx and dividing it for Dx itself (we have infinite possible outcomes in Dx so we have to divide for the range length to get the probability of each of them). For Dx tending to 0 we converge to the estimate of P(X=x) (the probability for X to fall into the range tends to zero with Dx and their ration tends to P(X=x)).
Some basic concepts of statistics and probability Let’s refer to continuous variables. Distinction between Cumulative distribution function (CDF, FX(x)) and probability density function (pdf, fX(x)): they contain the same amount of information! The CDF gives the probability of not exceedance of a random variable, i.e.: FX(x) = P(X≤x) The CDF has a very important meaning in hydrology. The CDF can be derived by integrating the pdf. If the random variable is defined in the range (-∞, +∞) then one can write: FX(x)=∫-∞xxfX(t)dt
Gaussian probability distribution Premise: meaning of probability distribution for continuous random variables: The Gaussian distribution is a simmetric distribution
Probability and Return Period • Return period: also known as a recurrence interval. It is a statistical measurement denoting the average recurrence interval between two events whose magnitude is equal or greater than a certain level. It is related to the probability of not exceedance: • P(X≤x) = [ T(x)-1 ] / T(x) T(x) = 1 / [ 1- P(X≤x) ] • Usual design return periods: • Sewer systems: 2-10 yrs • Road drainage systems: 20-40 yrs • Bridges: 100-200 yrs • Dams: 500-1000 yrs
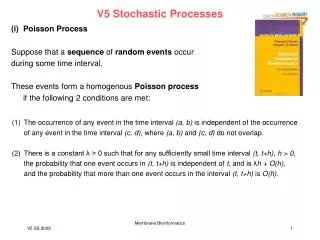
Independence • Independence: two events are independent if the occurrence of one event makes it neither more nor less probable that the other occurs. A random variable is said to be independent if one outcome does not have any influence on the subsequent one(s). • Remember: CDF and pdf can be used to describe independent random variables only. • Remember: so far, we are talking about independent events, like annual maximum rainfall or discharge, coin tossing, etc.
Generation of independent random variables • Under the above assumptions, it’s easy to generate outcomes from a probability distribution and therefore generate random variables. • Generate N outcomes from the Uniform distribution in the range [0,1]. • Generate independent outcomes from the random variable X as:x = F-1X{U[0,1]}
Processes • Time series like mean daily discharges can be regarded as collection of events. However, these events are not independent. In fact, daily discharges keep memory of them selves, for a time span that depends on catchment’s properties. Therefore time series cannot be generated by simply generating (independent) random variables. • Collection (families) or random variables are called “stochastic processes”. • A stochastic process is a family of random variables (“stochastic” is a synonym for “random”). • Natural processes can be treated as “realisations” of stochastic processes.
Processes, ergodicity, stationarity • Ergodicity: the average of a process parameter over time and • the average over the statistical ensemble are the same. Right or not, the analyst assumes that it is as good to observe a process for a long time as sampling many independent realisations of the same process. • Stationarity: a process is stationary when its statistical properties does not change over time or position. • Remember: ergodicity and stationarity are necessary assumptions to make inference about a stochastic process.
How to generate realisations from stochastic processes? • One needs to generate synthetic time series with the same statistical properties of the observed sample, including dependence properties. • One has to match the probability distribution of the data and the dependence structure of the data. • One way to decipher the dependence structure of data is to compute autocorrelation, which is a measure of linear dependence (a measure of the extent to which dependence can be approximated by a linear relationship). • Autocorrelation at lag k for a stationary process:
How to generate realisations from stochastic processes? • Plotting estimates of R(k) against k gives the autocorrelation function (ACF): Correlation can also be computed among two different processes X(t) and Y(t).
How to generate realisations from stochastic processes? • Let us assume that the dependence structure of the considered process can be represented by a linear relationship. We are assuming a linear stochastic process. • Therefore the process can be written in this way: • X(t) = f1X(t-1) + f2X(t-2) + …. + fnX(t-n) + e(t) • therefore obtaining an autoregressive process.
Autoregressive (AR) stochastic processes • Assumptions: • Linear process and Gaussian process (only the Gaussian distribution is preserved through linear transformations). • X(t) is zero mean. • e(t) is zero mean and uncorrelated. • Cross correlation between X(t) and e(t+k) is null for any positive k.
Generation of synthetic series from an autoregressive (AR) stochastic processes • Fit the stochastic process X(t); namely, fit its parameters and the variance of e(t). • Generate outcomes from e(t) from a Gaussian distribution with zero mean and proper variance. • Compute synthetic variables accordingly to the definition of stochastic process. • Problems: non Gaussianity, non stationarity.
Generation of synthetic series from an autoregressive (AR) stochastic processes • Generate e time series of e(t). • Compute the realisation of X(t) accordingly to the formulation of the given stochastic process. • Remember: any time that a given X(t) is not available we should assume that the missing observation is equal to the mean value of X(t), namely to 0.
Stationarity assumption • To meet the assumption of stationarity conditions must be imposed on the values of the coefficients. We do not go into details. • For instance, for the AR1 process it is necessary that the absolute value of the autoregressive coefficient is less than 1. • If the process is non stationary or non Gaussian a possible solution is to apply a preliminary transformation to the data.
Non Stationarity • From a physical point of view, non stationarity can be caused by changes in climate or land use. • A classical example of non stationarity is the presence of a linear trend in the data, or the presence of seasonality (also called ciclo-stationarity). • Trend and seasonality can be removed with a preliminary transformation.
Removal of seasonality • The literature proposes many techniques for removing seasonality from data. • The most classical techniques are based on estimating a periodic component in the mean value and variance of the data. Let’s indicate these periodic components with the symbols: • m(t) 1 ≤ t ≤ 365 • s(t) 1 ≤ t ≤ 365 • The deseasonalised time series is computed as: • Xd(t,t) = [X(t,t)- m(t)]/ s(t) • where t indicates the usual time index while t indicates the time position in the year (day, month…) in which the observation is collected.
Removal of trend • A similar technique is applied for removing the trend. • A linear trend is estimated on the data and the value of the trend at time t is subtracted by the corresponding observation collected at the same time t.
Non Gaussianity • Non Gaussianity can also be resolved by applying a preliminary transformation. The logaritmic transformation is often applied and is often successful. • Alternative: normal quantile transform (NQT) • Compute the cumulative frequency of the data, namely: • Fr[X(t)] = r[X(t)]/(N+1) where r is the rank of X(t) in the sample rearranged in descending order • 2) Compute XT(t) = F-1[Fr[x(t)]] where F-1 indicates the inverse of the Gaussian CDF with mean 0 and standard deviation 1 (canonic Gaussian distribution).
Statistical tests at the 95% confidence level for independence and Gaussianity • Independence: • 1) compute the ACF • 2) check that any autocorrelation coefficient is lower, in absolute value, than • 1.96 (1/N)0.5, • where N is the sample size. • Gaussianity • Compute the cumulative frequency of the data, namely: • Fr[X(t)] = r[X(t)]/(N+1) where r is the rank of X(t) in the sample rearranged in descending order • Compute |F[x(t)] - Fr[X(t)]| where F indicates the Gaussian CDF with mean and standard deviation equal to those of the sample. • Check that the above difference is lower than critical values given by a table.