INFORMATION SLIDE
INFORMATION SLIDE. I put results/figures for total 4 flooding events and 3 drought events. You can pick one or two events each from flooding and drought for the poster depending on the space. There is an empty slide inserted before each event so that you will know that it is a different event.

INFORMATION SLIDE
E N D
Presentation Transcript
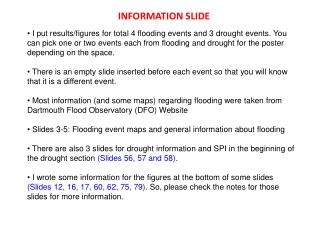
INFORMATION SLIDE • I put results/figures for total 4 flooding events and 3 drought events. You can pick one or two events each from flooding and drought for the poster depending on the space. • There is an empty slide inserted before each event so that you will know that it is a different event. • Most information (and some maps) regarding flooding were taken from Dartmouth Flood Observatory (DFO) Website • Slides 3-5: Flooding event maps and general information about flooding • There are also 3 slides for drought information and SPI in the beginning of the drought section (Slides 56, 57 and 58). • I wrote some information for the figures at the bottom of some slides (Slides 12, 16, 17, 60, 62, 75, 79). So, please check the notes for those slides for more information.
INFORMATION SLIDE • For Each Flooding event, the sequence of slides is like this: • Title slide • Flooding information from DFO • Flooding location map from DFO (if available) • MODIS flood inundation map from DFO (if available) • Daily rain rate and cumulative precipitation time series for 3 months around the flooding event from TRMM 3b42RT • Dailyrain rate and cumulative precipitation time series for 3 months around the flooding event from TRMM 3b42_V6 • 3-Hourlyrain rate and cumulative precipitation time series for 3 months around the flooding event from TRMM 3b42RT • 3-Hourly rain rate and cumulative precipitation time series for 3 months around the flooding event from TRMM 3b42_V6 • Histogramof all precipitation events for those 3 months for entire period (2003-2010). There are 4 histograms (2 daily and 2 3-hourly for 3b42RT and 3b42_V6 respectively) • Comparison of the highest rain events (amount or rate) from each year (2 figures for daily and 3-hourly for 3b42RT) • Comparison of the highest rain events (amount or rate) from each year (2 figures for daily and 3-hourly for 3b42_V6)
FLOODING EVENTS IN 2003 Source: Dartmouth Flood Observatory
FLOODING EVENTS IN 2007 Source: Dartmouth Flood Observatory
FLOODING EVENT TERMINOLOGIES • Recurrence Interval: The recurrence interval (sometimes called the return period) is based on the probability that the given event will be equaled or exceeded in any given year. • Severity Class: 3 severity classes based on the amount of damage and recurrence interval of a flood event. • Class 1: Large flood events; significant damage to structures or agriculture; fatalities; and/or 1-2 decades-long reported interval since the last similar event. • Class 2: Very large events; Very large events: greater than 20 year but less than 100 year recurrence interval, and/or a local recurrence interval of at 10-20 years. • Class 3: Extreme events; Extreme events: with an estimated recurrence interval greater than 100 years. • Flood Magnitude: The Dartmouth Flood Observatory (DFO) calculates the flood magnitude based on the following equation – • where, duration = duration of flooding in days, severity class = defined above in this section and affected region = area affected by flooding in squared kilometers.
Geographic Location Source: Dartmouth Flood Observatory
Flood Inundation Map from MODIS August 15, 2003 Source: Dartmouth Flood Observatory
Precipitation TS from TRMM 3B42RT Daily Data
Precipitation TS from TRMM 3B42_V6 Daily Data
Precipitation TS from TRMM 3B42RT 3-Hourly Data
Precipitation TS from TRMM 3B42_V6 3-Hourly Data
Precipitation Frequency from TRMM 3B42RT 3B42_V6 Daily Data 3-Hourly Data
Max. Precipitation TS from TRMM 3B42RT Daily Data 3-Hourly Data
Max. Precipitation TS from TRMM 3B42_V6 Daily Data 3-Hourly Data
Geographic Location Source: Dartmouth Flood Observatory
Flood Inundation Map from MODIS February 20, 2007 Source: Dartmouth Flood Observatory
Precipitation TS from TRMM 3B42RT Daily Data
Precipitation TS from TRMM 3B42_V6 Daily Data
Precipitation TS from TRMM 3B42RT 3-Hourly Data
Precipitation TS from TRMM 3B42_V6 3-Hourly Data
Precipitation Frequency from TRMM 3B42RT 3B42_V6 Daily Data 3-Hourly Data
Max. Precipitation TS from TRMM 3B42RT Daily Data 3-Hourly Data
Max. Precipitation TS from TRMM 3B42_V6 Daily Data 3-Hourly Data
Geographic Location Source: Dartmouth Flood Observatory
Flood Inundation Map from MODIS October 7, 2007 Source: Dartmouth Flood Observatory
Precipitation TS from TRMM 3B42RT Daily Data
Precipitation TS from TRMM 3B42_V6 Daily Data
Precipitation TS from TRMM 3B42RT 3-Hourly Data
Precipitation TS from TRMM 3B42_V6 3-Hourly Data
Precipitation Frequency from TRMM 3B42RT 3B42_V6 Daily Data 3-Hourly Data
Max. Precipitation TS from TRMM 3B42RT Daily Data 3-Hourly Data
Max. Precipitation TS from TRMM 3B42_V6 Daily Data 3-Hourly Data
Flood Inundation Map from MODIS September 17, 2007 Source: Dartmouth Flood Observatory
Precipitation TS from TRMM 3B42RT Daily Data
Precipitation TS from TRMM 3B42_V6 Daily Data
Precipitation TS from TRMM 3B42RT 3-Hourly Data
Precipitation TS from TRMM 3B42_V6 3-Hourly Data