Download

1 / 19
190 likes | 344 Views
This document explores the dynamics of the U.S. energy market from 2002 to 2004, focusing on energy flow, domestic production, and consumption patterns across various energy sources, including crude oil, coal, and renewables. It examines the cost implications of energy consumption and reflects on whether energy costs accurately represent their true usage costs. The report utilizes graphs and data from credible sources to illustrate domestic supply and international influence, alongside insights into the global petroleum market and the impact of oil price fluctuations.

E N D
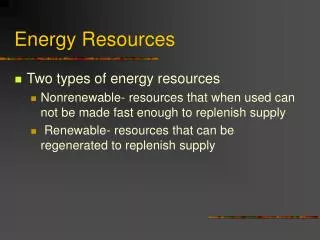
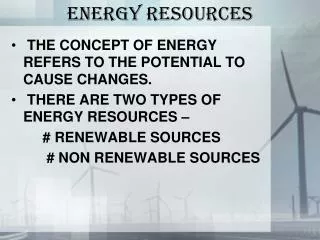
Energy Resources Wednesday, March 15
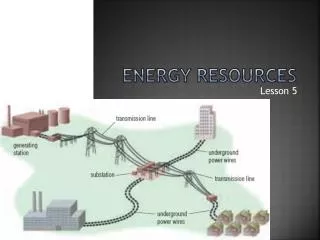
Energy Flow 2004 – United States Source: http://www.eia.doe.gov/emeu/aer/diagram1.html
U.S. Energy Market $ S D Energy BTUs
Example: Distribution of Consumption Among Alternative Sources of Energy, U.S. $ Sco Sr Scr D Energy BTUs Crude Coal Renewables
Do energy costs reflect true costs of their use? $ Sco Sr Scr D Energy BTUs Crude Coal Renewables
Do energy costs reflect true costs of their use? $ Sco Sr Scr D Energy BTUs Crude Coal Renewables
The Global Oil Market • http://www.npr.org/news/specials/oilseries/global.html
Qd Qt imported The U.S. Petroleum Market: Domestic Supply $ SD International Supply SI Pw Domestic Demand Graph #1 Quantity of petroleum
Loss Pd Pd2 Qd2 Qd The U.S. Petroleum Market: Domestic Supply $ SD International Supply SI Pw Domestic Demand Graph #2 Quantity of petroleum
Qd Qd Qt Qt The U.S. Petroleum Market: Domestic Supply $ SD SI2 Pw2 International Supply Pw SI Domestic Demand Graph #3 Quantity of petroleum
Qd Qd Qt The U.S. Petroleum Market: Domestic Supply $ SD SD International Supply Pw SI Domestic Demand Graph #4 Quantity of petroleum
Qd Qt Qt The U.S. Petroleum Market: Domestic Supply $ SD International Supply SI Domestic Demand D Graph #5 Quantity of petroleum
Impact of changes in oil prices • http://www.npr.org/news/specials/oilseries/conserve.html • http://marketplace.publicradio.org/shows/2005/06/24/PM200506244.html • http://marketplace.publicradio.org/shows/2005/06/24/PM200506245.html
Crude Oil -- Elasticity of Demand Source: J.B.Cooper “Price Elasticity of Demand for Crude Oil: Estimates for 23 Countries.” OPEC Review, March 2003
The U.S. Petroleum Market: Domestic Supply $ SD SI2 Pw2 International Supply SI Domestic Demand Q Quantity of petroleum
The U.S. Petroleum Market: Domestic Supply $ SD SI2 Pw2 International Supply SI Domestic Demand Q Quantity of petroleum
Welfare loss from self-sufficiency The U.S. Petroleum Market: Domestic Supply $ SD SI2 Pw2 International Supply SI Domestic Demand Graph #6 Quantity of petroleum