Download

1 / 16
160 likes | 195 Views
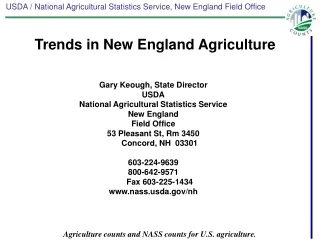
Trends in New England Agriculture. Gary Keough, State Director USDA National Agricultural Statistics Service New England Field Office 53 Pleasant St, Rm 2100 Concord, NH 03301 603-224-9639 800-642-9571 Fax 603-225-1434 www.nass.usda.gov/nh.

E N D
Trends in New England Agriculture Gary Keough, State Director USDA National Agricultural Statistics Service New England Field Office 53 Pleasant St, Rm 2100 Concord, NH 03301 603-224-9639 800-642-9571 Fax 603-225-1434 www.nass.usda.gov/nh
New England Land in Farms, Acres, 1997, 2002, 2007 acres Source: Census of Agriculture
Percentages of New England Farms by NAICS 1997, 2002, 2007 Source: Census of Agriculture
New England Cash Receipts 1997-2008 Million dollars Maple Syrup included in All Other Crops prior to 2002 Source: USDA NASS and Economic Research Service
New England Agricultural Related Income,1997, 2002, 2007 Million dollars Source: Census of Agriculture
New England States’ National Rankings • Percentage of all farms that have direct sales • New Hampshire, 1st • Connecticut, 2nd • Massachusetts, 4th, • Vermont, 5th • Maine, 6th • Rhode Island, 7th • Direct market sales as a percentage of all farm sales • Rhode Island, 1st • Massachusetts, 2nd • Connecticut, 4th • New Hampshire, 3rd • Vermont, 5th • Maine, 7th
New England States’ National Rankings • Average direct market sales per farm • Connecticut, $27,072 per farm, 1st • Massachusetts, $25,356 per farm, 2nd • Rhode Island, $25,270 per farm, 3rd • New Hampshire, $13,615 per farm, 5th • Vermont, $15,541 per farm, 8th • Maine, $10,803 per farm, 12th
Organic Sales as Percentage of all Agricultural Sales, New England States and U. S., 2002 and 2007 Census of Agriculture
Percentage of Farms with Organic Sales, New England and U.S. 2002 and 2007 Census of Agriculture
Percentage of Farms with Women Principal Operators,New England States and U.S., 2002 and 2007 Census of Agriculture
Percentage of Farms with Agri-tourism, 2007 Source: Census of Agriculture
Generated energy or electricity on the farm • 2.0% of New England farms, 1.1 • Practiced rotational or management intensive grazing • 18.9% of New England farms,17.6% of U.S. farms • Produced and sold value-added commodities • 8.7% of New England farms, 3.6% of U.S. farms • Marketed products through Community Supported Agriculture (CSA) • 2.3% of New England farms, 0.6% of U.S. farms Other New England and U.S comparisons Source: Census of Agriculture