Download
1 / 20
200 likes | 226 Views
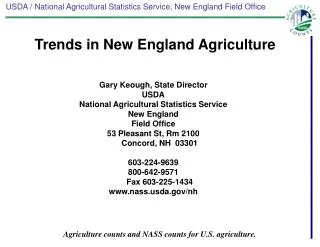
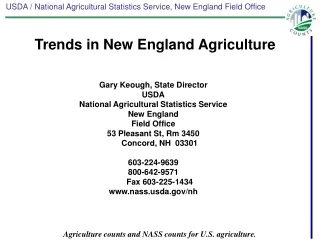
Trends in New England Agriculture. Gary Keough, State Director USDA National Agricultural Statistics Service New England Field Office 53 Pleasant St, Rm 3450 Concord, NH 03301 603-224-9639 800-642-9571 Fax 603-225-1434 www.nass.usda.gov/nh.

E N D
Trends in New England Agriculture Gary Keough, State Director USDA National Agricultural Statistics Service New England Field Office 53 Pleasant St, Rm 3450 Concord, NH 03301 603-224-9639 800-642-9571 Fax 603-225-1434 www.nass.usda.gov/nh
U.S. Rankings of New England StatesAverage Farm Income from Direct Market Sales • Massachusetts: 3rd, $21,717 • Connecticut: 4th, $21,436 • Rhode Island: 8th, $16,630 • New Hampshire: 10th, $15,075 • Vermont: 11th, $13,245 • Maine: 16th, $10,728
U.S. Rankings of New England StatesFarms with Direct Market Sales • New Hampshire: 2nd, 30.7% • Rhode Island: 3rd, 30.2% • Massachusetts: 4th, 28.4% • Maine: 5th, 28.3% • Vermont: 6th, 28.2% • Connecticut: 7th, 23.8%
U.S. Rankings of New England StatesDirect Market Sales as Percent of Farm Sales New Hampshire: 1st, 10.6% Rhode Island: 2nd, 10.5% Massachusetts: 3rd, 9.7% Connecticut: 4th, 5.5% Vermont: 6th, 3.5% Maine: 8th, 3.2%
Top New England Counties in Direct Market SalesSales and Ranking of U.S. Counties
Percentage of Farms with Women Principal Operators,New England States and U.S., 2002, 2007, and 2012 Censuses of Agriculture
What are your top 3 concerns related to what the 2012 data is telling you? How might these concerns impact our 50% by 2060 aspiration? • Limited land base • Limited processing facilities • Competition from lower cost of production areas
What are do you see as the top 3 opportunities related to what the 2012 data is telling you? How might these opportunities impact our 50% by 2060 aspiration? • Proximity to consumers • Water • Desire to get into farming