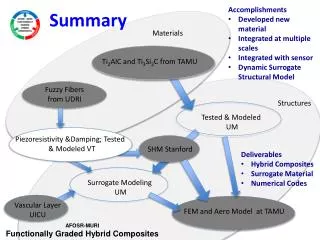
Genetic Diversity Analysis in Plant Populations Using Molecular Markers: Methods and Interpretations
This article covers the use of AFLP, RAPDs, RFLPs, and microsatellites for genetic diversity analysis in plant populations. Topics include marker selection, primer design, allele size determination, mutation processes, distance measurement, cluster analysis, and AMOVA. The significance of genetic variance within and between populations is interpreted for insights into reproduction patterns and gene flow. The impact of disease spread and dispersal gradients on genetic structure is explored, alongside examples such as Matsutake mushrooms. Methods for DNA sequence analysis, including alignment, tree testing, molecular clocks, and network approaches, are also discussed. This comprehensive guide provides valuable insights into genetic diversity studies in plants.

Genetic Diversity Analysis in Plant Populations Using Molecular Markers: Methods and Interpretations
E N D
Presentation Transcript
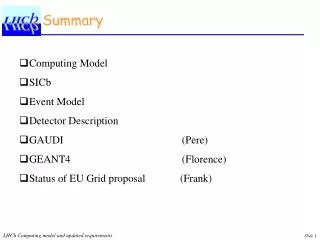
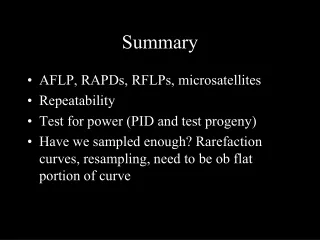
Summary • AFLP, RAPDs, RFLPs, microsatellites • Repeatability • Test for power (PID and test progeny) • Have we sampled enough? Rarefaction curves, resampling, need to be ob flat portion of curve
Microsatellites or SSRs • AGTTTCATGCGTAGGT CG CG CG CG CG AAAATTTTAGGTAAATTT • Number of CG is variable • Design primers on FLANKING region, amplify DNA • Electrophoresis on gel, or capillary • Size the allele (different by one or more repeats; if number does not match there may be polimorphisms in flanking region) • Stepwise mutational process (2 to 3 to 4 to 3 to2 repeats)
Jaccard’s • Only 1-1 and 1-0 count, 0-0 do not count 1010011 1001011 1001000
Jaccard’s • Only 1-1 and 1-0 count, 0-0 do not count A: 1010011 AB= 0.6 0.4 (1-AB) B: 1001011 BC=0.5 0.5 C: 1001000 AC=0.2 0.8
Now that we have distances…. • Plot their distribution (clonal vs. sexual)
Now that we have distances…. • Plot their distribution (clonal vs. sexual) • Analysis: • Similarity (cluster analysis); a variety of algorithms. Most common are NJ and UPGMA
Now that we have distances…. • Plot their distribution (clonal vs. sexual) • Analysis: • Similarity (cluster analysis); a variety of algorithms. Most common are NJ and UPGMA • AMOVA; requires a priori grouping
0.7 0.6 0.5 0.4 Frequency 0.3 0.2 0.1 0 0.90 0.92 0.94 1.00 0.96 0.98 Coefficient 0.7 0.6 0.5 0.4 0.3 Frequency 0.2 0.1 0 0.90 0.92 0.94 0.96 0.98 1.00 Coefficient Results: Jaccard similarity coefficients P. nemorosa P. pseudosyringae: U.S. and E.U.
0.7 0.6 Pp U.S. 0.5 Pp E.U. 0.4 Frequency 0.3 0.2 0.1 0.0 0.9 0.91 0.92 0.93 0.94 0.95 0.96 0.97 0.98 0.99 Jaccard coefficient of similarity P. pseudosyringae genetic similarity patterns are different in U.S. and E.U.
P. ilicis P. pseudosyringae P. nemorosa Results: P. nemorosa
Results: P. pseudosyringae P. ilicis P. nemorosa P. pseudosyringae = E.U. isolate
AMOVA groupings • Individual (within populations) • Population (among populations) • Region (between or among groups of populations) AMOVA: partitions molecular variance amongst a priori defined groupings
AMOVA • Percentage of variance by grouping (%) • Its statistical significance (P<0.05) • PHIst: ranges between 0 and 1 (1= populations are completely different; >0.2 significantly different, 0.1-02 moderately different, <0.1=not different. Remember PHI st can only be calculated among populations, not within. It is a proxy for Fst
How to interpret AMOVA results • Significant amount of genetic variance within populations= populations are constituted by genetically distinct individuals. Normally indication of sexual reproduction ongoing in population • Significant amount of genetic variance between populations= populations are genetically different, suggesting limited gene flow between them
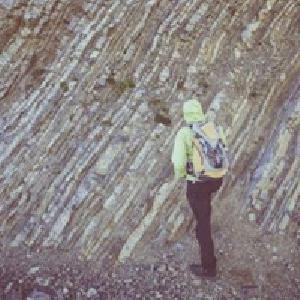
The “scale” of disease • Dispersal gradients dependent on propagule size, resilience, ability to dessicate, NOTE: not linear • Important interaction with environment, habitat, and niche availability. Examples: Heterobasidion in Western Alps, Matsutake mushrooms that offer example of habitat tracking • Scale of dispersal (implicitely correlated to metapopulation structure)---
The scale of disease • Curves of spore dispersal (rapid dilution effect, e.g most spores fall near source, but a long low tail, a few spores will travel long distances • Genetic structure of species: the more structure the more fragmented the less dispersal • Mantel tests, spatial autocorrelation: plot the genetic distance against the geographic distance
Distances between study sites White mangroves: Corioloposis caperata
Forest fragmentation can lead to loss of gene flow among previously contiguous populations. The negative repercussions of such genetic isolation should most severely affect highly specialized organisms such as some plant-parasitic fungi. AFLP study on single spores Coriolopsis caperata on Laguncularia racemosa
Using DNA sequences • Obtain sequence • Align sequences, number of parsimony informative sites • Gap handling • Picking sequences (order) • Analyze sequences (similarity/parsimony/exhaustive/bayesian • Analyze output; CI, HI Bootstrap/decay indices
Good chromatogram! Bad chromatogram… Reverse reaction suffers same problems in opposite direction Pull-up (too much signal) Loss of fidelity leads to slips, skips and mixed signals
Using DNA sequences • Testing alternative trees: kashino hasegawa • Molecular clock • Outgroup • Spatial correlation (Mantel) • Networks and coalescence approaches
Using DNA sequences • Bootstrap: the presence of a branch separating two groups of microbial strains could be real or simply one of the possible ways we could visualize microbial populations. Bootstrap tests whether the branch is real. It does so by trying to see through iterations if a similar branch can come out by chance for a given dataset • BS value over 65 ok over 80 good, under 60 bad
From Garbelotto and Chapela, Evolution and biogeography of matsutakes Biodiversity within species as significant as between species