Download

1 / 22
220 likes | 415 Views
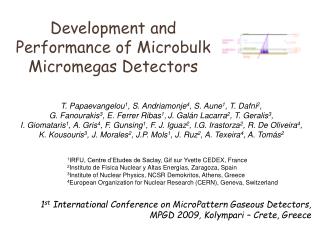
Performance Studies of BULK Micromegas with Different Amplification Gaps. Purba Bhattacharya 1 , Sudeb Bhattacharya 1 , Nayana Majumdar 1 , Supratik Mukhopadhyay 1 , Sandip Sarkar 1 , Paul Colas 2 , David Attie 2.

E N D
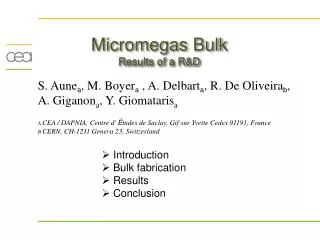
Performance Studies of BULK Micromegas with Different Amplification Gaps Purba Bhattacharya1, Sudeb Bhattacharya1, Nayana Majumdar1, Supratik Mukhopadhyay1, Sandip Sarkar1, Paul Colas2, David Attie2 1 Applied Nuclear Physics Division, Saha Institute of Nuclear Physics, Kolkata, India 2DSM/IRFU, CEA/Saclay, Gif-sur-Yvette CEDEX, France
Motivation • Micromegas – promising candidate for TPCs including ILD main tracker • Bulk Micromegas – built using printed circuit board fabrication techniques • Important parameters that determine choice of a particular bulk over another are detector gain, gain uniformity, energy and space point resolution, comfortable operating regime (in terms of voltage settings, signal strength etc), stability and ageing characteristics (ion back-flow), capability to efficiently pave large readout surfaces with minimized dead zone (due to spacers) … • These parameters are known to depend on geometry of the detector (amplification gap, mesh hole pitch, wire radius etc), electrostatic configuration within the detector, gas composition, pressure … • Systematic comparison of different bulk Micromegas has been carried out to weigh out various possibilities and options and guide our choice for specific applications • Comparison with numerical simulations using Garfield has been performed to verify the mathematical models and confirm our understanding of the device physics
BULK MICROMEGAS • Details of BULK Micromegas: • 10x10 cm2 active area • Amplification gap: 64 m, 128 m, 192 m and 220 m • Stainless steel mesh, wire diameter 18 m, pitch 63 m/ 78 m • Dielectric Spacer, diameter 400 m, pitch 2 mm Microscopic view of Bulk Micromegas Mesh Hole ~ 45m Spacing between two spacer ~ 2 mm Spacer Diameter ~ 400m Pitch ~ 63m
Experimental Set Up Gas Cylinder Purification System Residual Gas Analyzer Gas Mixing System Power Supply (High Voltage) (N471A) Gas Flow In Pressure Gauge RGA Spectrum for fixed Argon – Isobutane Gas Mixture Gas Chamber & Detector Gas Flow Out Pre-Amp (Model No. – 142IH) Filter Multi- Channel Analyzer Amplifier (ORTEC 672) Oscilloscope Typical MCA Spectrum of 55Fe
Radiation Source Numerical Simulation Simulation tools Ionization • Garfieldframework: to model and simulate two and three dimensional drift chambers • Ionization: HEED • Drift and Diffusion: MAGBOLTZ • Amplification:MAGBOLTZ • Potential, Field:neBEM (nearly exact Boundary Element Method) Drift and Diffusion of Electrons Drift Volume Amplification Gap Amplification and further Diffusion Transfer Gap Readout Pads Pad Response Signal Garfield + neBEM + Magboltz + Heed
Variation of Electric Field (a) With Mesh Hole Pitch (Wire Diameter: 18 m) With Amplification Gap (b) (Please note, Y-Axis is in log scale) In each case detector characteristics (gain, resolution…) changes accordingly
Gain :G = Nt / Np = kP/ Np ,where NtTotal number of electrons Np Primary electrons k Constant, depends on Preamplifier, Amplifier, MCA specification P Peak Position (Maximum allowable voltage: Sparking limit) Variation of gain with amplification field in different argon-based gas mixture (drift field 200 V/cm) Higher gain can be obtained in Argon Isobutane Gas Mixture
Variation of gain with amplification field for three different amplification gap – higher gain can be obtained with larger amplification gap leading to a comfortable operating regime (Maximum allowable voltage: Sparking limit) Variation of gain with amplification field for two different pitch – for larger pitch, sparks start at higher field and so a higher value of gain can be obtained
Comparison with Simulation Results • Trend similar in case of both detectors→ Simulated results considerably lower without Penning • Roles of different parameters : Penning Transfer Mechanism → Increase of gain, Needs further investigation on transfer rates • The simulated gain in other gas and other gap also agrees quite well with experimental data
Energy Resolution :R = P/P, where p r.m.s. of the pulse height distribution P peak position Variation of energy resolution at 5.9 keV with gain in different argon-based gas mixture At this drift field, at higher gain, Argon Isobutane gas shows better energy resolution
Variation of energy resolution with gain for three different amplification gap – 128 m shows better resolution Variation of energy resolution with gain for two different pitch – 63 m shows better resolution
Comparison with Simulation • Numerical estimates follow trend of measured data • Gain variation and electron transparency needs further investigation • Similar trend observed in other cases also
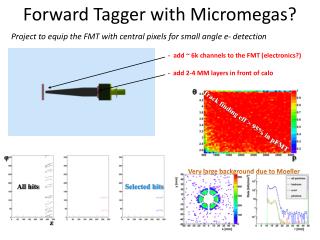
Estimation of Electron Transparency • Fraction of electrons arriving in amplification region • Depends on field ratio, drift voltage • Depends on hole-pitch • Every electron collision is connected with red lines, • inelastic collisionsexcitations ionizations. Experiment : Ratio of signal amplitude at a given Edrift over signal amplitude at Edrift where gain is maximum • Simulation: • Microscopic tracking of electrons from randomly distributed points (100 m above mesh) • Two different models for mesh modelling: one dimensional thin wire segments for Edrift < 100 V/cm and three-dimensional polygonal approximation of cylinders for Edrift > 100 V/cm
Experiment: Variation with electron transparency with field ratio for three different amplification gap • At this pitch value, the electron transparency reaches maximum value at much higher drift field • The larger gap detector reaches maximum value at lower drift field in comparison with smaller gap
Comparison of Experimental Data with Simulation Results (Amplification Gap: 64 m and 192 m; Pitch: 63 m) • Simulation Results agree quite well with Experimental Data • Calculation with higher pitch (78 m) is in progress
Ion Backflow • Secondary ions from amplification region drift to drift region • Distortion of electric field; degrades stable operation of detector • Micromegas micromesh stops a large fraction of these ions • Backflow fraction : Nb/Nt (1/FR)(p/t)2 where • Nb average number of backflowing ions • Nt average total number of ions • FR field ratio, • p pitch of the mesh, • t diffusion Avalanche of Electrons (2D picture) Drift of Secondary Ions (2D picture)
Simulation of IBF: Variation with IBF with Field Ratio a) for different argon based gas mixture (Amplification gap: 128 m) b) for three different amplification gap (Ar:Isobutane 90:10) • Preliminary simulation results show expected trends • Need further investigation and experimental verification
Experimental Set Up: • Preliminary data was taken at CEA, Saclay • We are trying to build up a similar set up at SINP • Value of IBF follows the theoretical prediction • Besides the contribution of ions from avalanche, additional contribution from ions between drift plane and test box window affect the data – implementation of 2nd drift mesh – improvement of results
Effect of Spacer (Diameter 400 m, Pitch 2 mm, Amplification Gap 128 m) Electric field in axial direction through different holes • Spacers cause significant perturbation resulting in increased field values, particularly in the regions where cylinders touch the mesh • Electron drift lines get distorted near the dielectric spacer Without Spacer Drift lines and Avalanche With Spacer
Electron Transparency and Gain (Without and With Spacer) • Electrons are lost on the spacer resulting in reduced gain • Signal strength reduces and it has a longer tail Signal
Summary Experiments and numerical simulations carried out using different bulk Micromegas (amplification gaps 64 m, 128 m, 192 m, 220 m; Pitch 63 m, 78 m) in several argon based gas mixtures Important detector parameters such as gain, energy resolution, transparency estimated Observed conflicting advantages of different parameters, e.g., configuration that leads to higher gain and more stable operation (amplification gap 220 m) provides less attractive energy resolution Smaller pitch (63 m ) found to be generally more useful Preliminary calculation of ion back flow compare favorably with measurements Effects of spacers on gain and signal indicated significant changes occurring around the spacer Successful comparisons with simulation indicate that the device physics is quite well understood and suitably modeled mathematically
Acknowledgement We acknowledge CEFIPRA for partial financial support We thank our collaborators from ILC-TPC collaboration for their help and suggestions We acknowledge Rui de Oliveira and the CERN MPGD workshop for technical support We happily acknowledge the help and suggestions of the members of the RD51 collaboration We are thankful to Abhik Jash, Deb Sankar Bhattacharya, Wenxin Wang for their help in some measurement and Pradipta Kumar Das, Amal Ghoshal for their techinal help We thank our respective Institutions for providing us with necessary facilities Thank YOU