Download
1 / 31
310 likes | 437 Views
VSC DATA COLLECTION. William S. Griswold. Presentation Agenda. 1. USCG Strategic Plan. 2. NASBLA Work Group. 3. Project purpose. 4. Results to date. 5. Q&A. STRATEGIC PLAN of the National Recreational Boating Safety Program 2012-2016.

E N D
VSC DATA COLLECTION William S. Griswold
Presentation Agenda 1 USCG Strategic Plan 2 NASBLA Work Group 3 Project purpose 4 Results to date 5 Q&A
STRATEGIC PLAN of the National Recreational Boating Safety Program 2012-2016 Objective 8: Operator Compliance – USCG Required Safety Equipment Increase compliance levels for specific required safety equipment on recreational boats. Strategy 8.1 – Evaluate Incidents of Non-Compliance with specific USCG Required Safety Equipment
NASBLA - ERACEngineering, Reporting & Analysis Comm. Charge C-3: Continue to review the data from USBI (and affiliated organizations’) efforts to capture the reasons why vessels fail a Vessel Safety Check (VSC), and the VSC program analyses conducted to date by the USBI project partners. Assess the significance of the data and analyses and determine whether there are any potential applications of – and implications for – the data findings beyond the original intent. [National RBS Plan Performance Goal for reducing casualties; RBS Obj. 8, Operator Compliance-Required Safety Equipment; NASBLA’s strategic goal of conducting research for evaluating RBS program efforts and informing decision makers.]
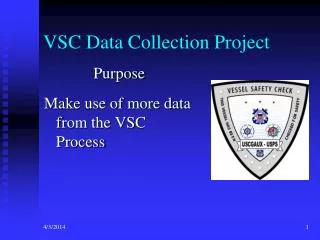
Purpose of the VSC Data Collection Project Make better use of data from the VSC Process
USBI – United Safe Boating Institute • Undertook project, funded by CG grant & Involving two parent organizations: • USCG Auxiliary • United States Power Squadrons (USPS)
Determine Why Vessels Fail VSCs CG Aux - July 12-Dec. 13 159,118 vessel exams 119,267 passed 39,851 FAILED (25%) Compare with Accident Data Correlations ? Trends? Regional Differences? Archive for Other Future Uses Incorporate in future data collection systems
AUXDATA is on life support • No funds to change VSC collection • Trial run 11 years ago – not possible • Why USBI? • Represents both CGAux & USPS • Has an existing web site for collection
Gather only important information • Only need info from exams that FAILED • No personal information, but some other info that’s already captured on form 7012
Form 7012 Used by both USPS & CGAux
Auxiliary Examiners • Will be asked to complete their VSCs as always • For those vessels that fail, the examiner will go to the web page at http://www.usbi.org/vsc.php and enter the reasons the vessel failed
USPS Vessel Examiners Asked to complete their VSCs with the additional data asked for The Squadron VSC Chairs entered the VSC data on a newly designed USPS input page rather than the old page Data passed to the USBI database, merged with the Auxiliary data, quarterly
MEASUREMENT • To see if this pilot program is capturing significant data, we can compare number of VSC failures in each state between AUXDATA and the Pilot Program • This measurement might help future changes
Example of Measurement CGAux VSC’s July 1, 2012 – Dec. 31, 2013 Data taken from AUXINFO Exams159,118 Exams passed 119,267 Failed – 39,851 (25%) CGAux failures reported to USBI 1,553 – 3.8% of total above
ANALYSIS – so far Data collected is up to end of 2013 Hurricane Sandy flooded CGAux host equipment Oct. 29, 2012 shutting down web site for 2 months USPS data intact – National input from most states CGAux data incomplete – Extra step for examiners preventing significant numbers. TOTAL FAILED EXAMS – 9,163 (83% of total from USPS)
Focusing on 5 reasons which could cause an accident, reports show % of total failures: • Navigation Lights 14% • Visual Distress Signals 13% • Fire Extinguishers 11% • Life Jackets 5% • Sound Device 4% Notes: An examination may result in a failure for more than one reason These differences are statistically significant
TOP TEN STATES REPORTING State% of Failures% of Registered Vsls FL 13% 0.12% OH 10% 0.18% MI 9.6% 0.10% NC 6.5% 0.14% NY 5.7% 0.09% MD 5.3% 0.22% CA (TIE) 4.1% 0.04% VA (TIE) 4.1% 0.14% TX 3.4% 0.05% WI 3.0% 0.04%
Summary table of failures 5 out of a possible 15 failure categories
Possible reasons for differences in failure patterns • Lack of consistency in criteria used by each organization and reporting to USBI • Differences in boat populations being examined by the two organizations (locations, size of boats, other) • There is some consistency between both organizations looking at types of failures
VISUAL DISTRESS SIGNALS (VDS) • CGAux reported 514 VDS failures – 26% were on Inland Waters • USPS reported 1,771 VDS failures – 51% were on Inland Waters • Some concern about Federal requirements, State requirements on Inland Waters and Vessel Examiners getting it right • 46% of VDS failures reported on Inland or River waters.
Other Interesting Facts • 52% of USPS “Pollution Placard” failures were on vessels <26 feet – not a Fed. Requirement • Florida had the highest # failures – 13%, • Ohio and Michigan had 10% each • These three states had 32.6% of the reported failures , 18% of registered boats, and 19.95% of reported boating accidents in 2012
MORE STUFF • 9,163 failed VSC indicated 17,680 reasons for failure – averaging 2 failures per failed exam • 46% Auxiliary failures had multiple reasons • 58% USPS failures had multiple reasons • 2012 Accident statistics – 74% accidents & 81% fatalities occurred on Inland bodies of water • As above – 75% of vessels & 83% involving death were on vessels less than 26 feet • 54% of VSC failures were on vessels less than 26’
And in Conclusion • This project is a long term wish to use VSC’s as a vehicle to determine why boats fail, where they are and what they don’t have on board • Perhaps, we can correlate carriage deficiencies with boating accidents • Other data bases have not been able to tell us why; maybe our method will help direct our educational efforts, and public awareness initiatives
More Conclusions • VSC’s reach less than 1% of the total registered boats • Many of the VSC failures revealed discrepancies with: Overall Condition Display of Numbers Registration Pollution Placard Not associated with CAUSES of accidents • Numbers and Trends did not vary much from the report given in early 2013 compared to 2014
VSC – BOTTOM LINE Reinforce education messages on: Navigation Lights VDS (let’s train examiners what’s ok) Fire Extinguisher It appears we’re OK with life jackets and sound devices Is there a correlation with accidents ?
Check Us Outhttp://www.usbi.org/ We are glad to be partners with NASBLA NSBC NWSC If you have any questions, please contact us wsgriz@aol.com
? Q & A time