Download
1 / 1
10 likes | 129 Views
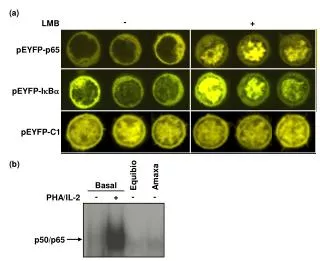
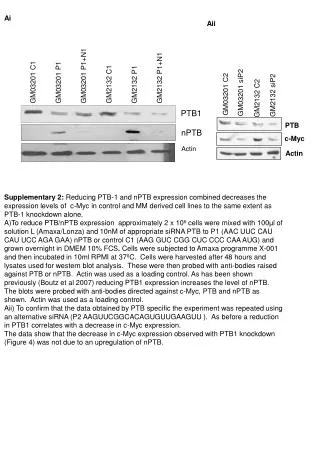
Ai. Aii. GM2132 C1. GM2132 P1. GM2132 P1+N1. GM03201 P1+N1. GM03201 C1. GM03201 P1. GM2132 siP2. GM2132 C2. GM03201 siP2. GM03201 C2. PTB1. PTB. nPTB. c-Myc. Actin. Actin.

E N D
Ai Aii GM2132 C1 GM2132 P1 GM2132 P1+N1 GM03201 P1+N1 GM03201 C1 GM03201 P1 GM2132 siP2 GM2132 C2 GM03201 siP2 GM03201 C2 PTB1 PTB nPTB c-Myc Actin Actin • Supplementary 2: Reducing PTB-1 and nPTB expression combined decreases the expression levels of c-Myc in control and MM derived cell lines to the same extent as PTB-1 knockdown alone. • To reduce PTB/nPTB expression approximately2 x 106 cells were mixed with 100µl of solution L (Amaxa/Lonza) and 10nM of appropriate siRNA PTB to P1 (AAC UUC CAU CAU UCC AGA GAA) nPTB or control C1 (AAG GUC CGG CUC CCC CAA AUG) and grown overnight in DMEM 10% FCS. Cells were subjected to Amaxa programme X-001 and then incubated in 10ml RPMI at 37ºC. Cells were harvested after 48 hours and lysates used for western blot analysis. These were then probed with anti-bodies raised against PTB or nPTB. Actin was used as a loading control. As has been shown previously (Boutz et al 2007) reducing PTB1 expression increases the level of nPTB. The blots were probed with anti-bodies directed against c-Myc, PTB and nPTB as shown. Actin was used as a loading control. • Aii) To confirm that the data obtained by PTB specific the experiment was repeated using an alternative siRNA (P2 AAGUUCGGCACAGUGUUGAAGUU ). As before a reduction in PTB1 correlates with a decrease in c-Myc expression. • The data show that the decrease in c-Myc expression observed with PTB1 knockdown (Figure 4) was not due to an upregulation of nPTB.