Download
1 / 32
320 likes | 462 Views
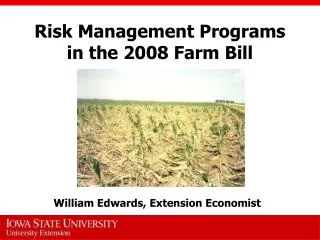
2002 U.S. Farm Bill Revisited: Impacts, Implications of the WTO Ruling and the U.S. Budget. 12th Annual Farming for Profit! Moose Jaw, SK, Canada June 27, 2005 Flynn Adcock and Parr Rosson Center for North American Studies Dept. of Agricultural Economics Texas A&M University. Overview.

E N D
2002 U.S. Farm Bill Revisited:Impacts, Implications of the WTO Ruling and the U.S. Budget 12th Annual Farming for Profit! Moose Jaw, SK, Canada June 27, 2005 Flynn Adcock and Parr Rosson Center for North American Studies Dept. of Agricultural Economics Texas A&M University
Overview • Program Spending & Summary of FSRIA Provisions • Implications of Budget Reconciliation • Implications for WTO Obligations • Case: U.S. Farm Bill, Canadian Cattle Feeding, and BSE
U.S. Federal Budget Outlays byFunction, FY 2005 Physical Resources includes: transportation, community and regional development, etc. Source: Budget of the U.S. Government; www.whitehouse.gov/omb/budget/fy2003/pdf/hist.pdf
Summary of Provisions • FSRIA Signed May 13, 2002 • Effective for Crop Years 2002-07 • New Spending from $45.1-$51.7 Billion (2002-2007) • Major Increases in Environmental, Conservation, & Energy • Institutionalizes Previous Ad-hoc Funding for Commodity Programs
FSRIA Titles • Title I: Commodity Programs* • Title II: Conservation* • Title III: Trade* • Title IV: Nutrition • Title V: Credit • Title VI: Rural Development • Title VII: Research & Related Matters • Title VIII: Forestry • Title IX: Energy • Title X: Miscellaneous*
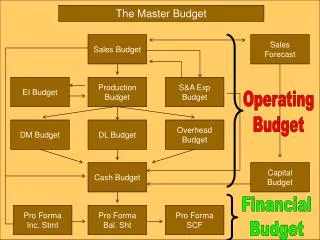
Farm Bill Spending, 2002-07 • Total Cost: $273.9 Billion • Commodity Programs: $98.9 Billion • Conservation: $21.3 Billion • Food & Nutrition: $149.6 Billion • Total Over Baseline: $51.7 Billion • Average Annual Cost: $8.6 Billion (over baseline)
Farm Bill Program Spending by Title, Budget Authority, FY 2002-2007 Excludes funding for discretionary programs which is provided through annual appropriations.
FSRIA Provisions • Commodity Programs-Sources of Payments to Producers • Direct Payments (AMTA/PFC) - Continuation • Marketing Loan Gain (MLG) or Loan Deficiency Payments (LDP) - Continuation • Initiated New Counter-cyclical Payments (CCP) - reinstates Target Prices*
FSIRA Provisions (cont.) • Soybeans & Peanuts Covered Under All Payment Provisions • Dry Peas, Lentils, and Chickpeas now Covered under Marketing Loan Program • Required Country of Origin Labeling at Retail for Meats, Seafood, Produce, Peanuts (MCOOL Provisions Postponed for all but Seafood) • CCP (counter-cyclical payments) for Dairy farmers
Crops 1996 Farm Bill 2001 Rate 2002 Farm Bill 2002 – 03 Rate 2002 Farm Bill 2004 – 07 Rate Corn ($/bu) 1.89 1.98 1.95 Sorghum ($/bu) 1.71 1.98 1.95 Wheat ($/bu) 2.58 2.80 2.75 Upland Cotton ($/lb) 0.5192 0.52 0.52 Rice ($/cwt) 6.50 6.50 6.50 Barley ($/bu) 1.65 1.88 1.85 Oats ($/bu) 1.21 1.35 1.33 Soybeans ($/bu) 5.26 5.00 5.00 Minor Oilseeds ($/lb) 0.093 0.096 0.093 Peanuts ($/ton) N/A 355.0 355.0 Dry Peas ($/cwt) N/A 6.33 6.22 Lentils ($/cwt) N/A 11.94 11.72 Small Chickpeas ($/cwt) N/A 7.56 7.43 U.S. Loan Rates Wheat loan rates will be announced by class: hard red spring, hard red winter, soft red winter, soft white wheat, and durum.
FSIRA Provisions (cont.) • Wool, Mohair, & Honey Get Marketing Loan Payments • Conservation Reserve Program (CRP) Acreage to Expand from 36.4 ma to 39.2 ma • Environmental Quality Incentive Program (EQIP): 6 fold increase, $400 million in 2002 increasing to $1.3 billion in 2007
Farm Bill Payments • Direct Payments =Payment rate x (Base acres x .85) x Farm Program Yield • Counter-cyclical Payments (CCP) • Secretarial Action Required to Implement Target price -Effective price (Higher of Market price or loan rate plus Direct payment rate) Counter-cyclical payment rate ($/unit) • CCP = CCP rate x (Base acres x .85) x Updated Farm Program Yield
Potential Impacts of Farm Bill • U.S. Dry Pea and Lentil Planted Area Expected to Rise • Marketing Loan Program • Favorable Lentil Prices/Falling Alternative Crop Prices • Relatively Low Input Costs • Long-term Benefits from including in Crop Rotation • Most Growth in ND, WA, MT
Potential Impacts of Farm Bill • Wheat Production up from Recent Low in 02/03 MY • Barley Production down from Highs of Early 1990’s – Less than ½ of CN • Canola Crop Grew from near Zero in 90 but has fallen since 2001 – Very Small compared to Canada
Potential Impacts of U.S. Budget Reconciliation • Research by TAMU AFPC in early 2005 • Impacts are dependent on which parts of the program are adjusted • Reducing Direct Payments (de-coupled) would have the greatest impact on income because fixed • Counter-Cyclical and Loan Deficiency/ Marketing Loan Gain Payments are not fixed but based on market conditions • Simulation results show that loan rate reductions would be least harmful to producers • Cuts to CRP were not analyzed
WTO Issues/Impacts • Direct payments – Green Box (don’t count) • MLGs/LDPs – commodity specific Amber Box • CCPs – noncommodity specific Amber Box • Amber Box limit is $19.1 billion annually • Noncommodity specific support is not included when calculating the AMS as long as it is <5% of the value of agricultural production • These amber box payments are referred to as “de minimis” (trifling amount) • If >5% then full amount counts
WTO and the New Farm Bill Billion Dollars Aggregate Measure of Support (AMS) refers to the $19.1 billion annual spending cap on Amber box payments. Source: FAPRI
WTO Issues/Impact (Continued) • Farm Bill Adjustment Authority Related to Doha Round (WTO) Compliance • Potential for Year 1 cut in support ceiling of 20%, from $49.1B to $39.3B • Will have to Adjust Export Credit Guarantees to Comply w/6 Month Maximum • Changes to Some Programs to Make More “Green”
Implications of WTO Cotton Case • Findings against U.S. cotton-related programs • Step 2 of Cotton Program Likely Gone • Restrictions on what crops can be planted on program acreage (fruits/vegis) may be lifted • Findings against Export Credit Guarantee Program as well – Some Changes as Early as Next Month • These Findings will be considered during Budget Reconciliation and for 2007 Farm Bill
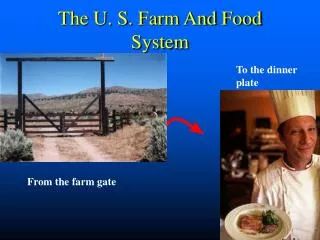
U.S. Farm Bill, Canadian Cattle Feeding, and BSE • Investment in Prairie Province Beef Industry • Availability of Cheap U.S. Corn and Export of this Corn to the Canadian Cattle Feeding Industry • Concern over the Potential Impacts of MCOOL • Dynamics Changed with Discovery of BSE • Ban on Canadian Cattle Exports to U.S. and Low Canadian Prices Led to More Investment in Prairie Beef Industry • Canadian Industry May be Stronger when Normal Trade Resumes – But With Uneven Benefits
Summary and Conclusions • U.S. Farm Spending, while High, is Low Compared to Rest of U.S. Budget • Farm Spending Less than Mid-80s in Real Terms • Most of Farm Bill Spending in Food/Nutrition Programs – 36% in Commodity Support • Direct Payments are Green Box; MLG/LDP and CCP are Amber Box • Inclusion of LDP for Lentils/Peas Spurred the Greatest Shift in Production • Budget Reconciliation Impacts are Unclear
Summary and Conclusions (Continued) • Doha Round, Cotton Case, and Budgetary Concerns to Impact Next Farm Bill • Inclusion of Fruits and Vegetables in the Program and/or as Crop Alternative for Program Acres??? • MCOOL Less of a Threat than BSE • Canadian Cattle Industry Likely Stronger Post-BSE but Cow/Calf Producers will Need Greater Recovery Time • U.S. Farm Bill Impacts on Canada Appear to be Less than Other Factors such as BSE or Canadian Policy Changes