Normal Distribution
Introduction of Normal distribution and Examples

Normal Distribution
E N D
Presentation Transcript
•This distribution is a limiting case of Binomial distribution •When p→ ? ?X X → ∞
The continuous random variable X is said to have a normal distribution,if its Probability density function is defined as ?√???−? ?(?−? )? ? •?(?) = ? −∞ ≤ ? ≤ ∞,? > ? here ? ?X ? ?X ??X?? ? Xˤ ?X ?ℎ X?X??r ˤˤ?Xˤ?Ԓ?ˤ?X
• Mean of the Normal distribution ?(?) = ? • Variance of the normal distribution is ??
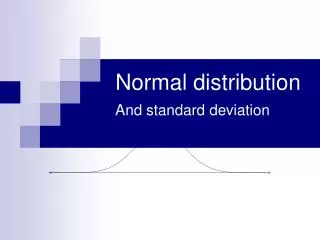
• The normal probability curve with mean ? and standard deviation ? is given by ? ?(?−? ?√???−? −∞ ≤ ? ≤ ∞,? > ? )? ?(?) = ? • The curve is bell-shaped and symmetrical about the line x= The curve is bell-shaped and symmetrical about the line x=?. •
Any normally distributed data can be converted to the standardized form using formula: ? =(? − ?) ? • Where 1. X is the data point in question 2. Z is a measure of the number of standard deviations of that data point from the mean
If? = 50 ?X ? = 10, XˤX (I) P(50 ≤ ? ≤ 80), ? =(?−?) =(?−50) ? 10 z=(50−50) =0 when X=50 10 and z=(80−50) =3 when X=80 10 hence P(50 ≤ ? ≤ 80)=P(0 ≤ ? ≤ 3)=0.4987(table-1) z=0 x=? = 50 z=3 x=80
(II) P(60 ≤ ? ≤ 70), (P(60 ≤ ? ≤ 70) = ?(1 ≤ ? ≤ 2) = (Area from z=0 to z=2)-(Area from z=0 to z=1) =0.4772-03413=0.1359 z=0 x=? = 50 z=2 z=1
(III) P(30 ≤ ? ≤ 40), (P(30 ≤ ? ≤ 40) = ?(−2 ≤ ? ≤− 1) Due to symmetry area between z=-1 to z=-2 will be the same as between z=1 to x=2 = (Area from z=0 to z=2)-(Area from z=0 to z=1) =0.4772-03413=0.1359 z=-1 z=-2 z=0 x=? = 50
(II) P(40 ≤ ? ≤ 60), (P(40 ≤ ? ≤ 60) = ?(−1 ≤ ? ≤ 1) = twice the (Area from z=0 to z=1) =2 X 0.3413=0.6826 z=0 x=? = 50 z=1 z=-1
Solution- Let ? ? ?ℎ ? ?X ?X ? ? ?ℎ ˤ??X ?X lˤ??ˤ?X ?X ?ℎ ˤˤ?Xˤ?Ԓ?ˤ?X Normal variate z=?−? ? As 31% of items are under 45 and 8 % over 64 ∴ ?? ? = 64, ? ℎ?l z=64−? ?=z1
42% 19% 31% 8% x=? z=0 x=64 z=z2 x=45 z=z2
Area from z=0 to z=z1 is 42% i.e. 0.42. The value of z1 corresponding to area 0.42 from the table is 1.405 ∴ 1.405 =64−? ? .........(1) Similarly at x=45, ??? = ?45−? ??=??2? Area between x=45 i. e. z=z2 to x=? (? = 0) is the same numerically as ? ?? X ? = 0 ?? ? = ?2 which is 19%. Now the value of normal variate z2 corresponding to area 0.19 is 0.495. ∴ ?45−? ??=?0.495? ∴45−? ?=0.495.......(2) From (1) and (2) ? = 50 ?X ? = 10.