Download
1 / 37
370 likes | 528 Views
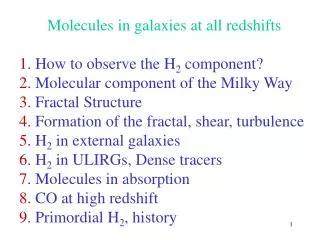
Molecules in galaxies at all redshifts 1. How to observe the H 2 component? 2. Molecular component of the Milky Way 3. Fractal Structure 4. Formation of the fractal, shear, turbulence 5. H 2 in external galaxies 6. H 2 in ULIRGs, Dense tracers 7. Molecules in absorption

E N D
Molecules in galaxies at all redshifts 1. How to observe the H2 component? 2. Molecular component of the Milky Way 3. Fractal Structure 4. Formation of the fractal, shear, turbulence 5. H2 in external galaxies 6. H2 in ULIRGs, Dense tracers 7. Molecules in absorption 8. CO at high redshift 9. Primordial H2, history
How to observe the H2 component? SAAS-FEE Lecture 1 Françoise COMBES
The H2 molecule • Symmetrical, no dipole • Quadrupolar transitions ΔJ = +2 • Light molecule => low inertial moment and high energy levels • Para (even J) and ortho (odd J) molecules (behave as two different species)
H2 is the most stable form of hydrogen at low T dominant in planetary atmospheres? Formation: on dust grains at 10K However formation still possible in primordial gas (H + H- Palla et al 1983) Destruction: through UV photons (Ly band) Shielded by HI, since the photodissociation continuum starts at 14.7eV, and photo-ionization at 15.6 eV (HI ionization at 13.6 eV) Self-shielding from low column densities 1020 cm-2 in standard UV field H2 will be present, while other molecules such as CO would be already photo-dissociated
Potential curves involved in the Lyman and Werner bands (Roueff 00)
Ortho-Para transitions? • Formation in the para state not obvious • Large energy of formation 2.25 eV/atom • ortho-para conversion in collisions H++H2 • n(O)/n(P) = 9.35 exp(-170/T) • Anormal ratios observed (ISO) • IR lines J=2-1 at 42 μ, 1-0 at 84 μ ? • A = 10-10 cm3/s (Black & Dalgarno 1976)
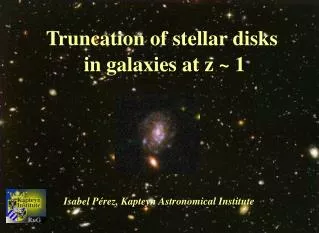
Infrared Lines of H2 • Ground state, with ISO (28, 17, 12, 9μ) • S(0), S(1), S(2), S(3) • From the ground, 2.2 μ, v=1-0 S(1) • excitation by shocks, SN, outflows • or UV-pumping in starbursts, X-ray, AGN • require T > 2000K, nH2 > 104cm-3 • exceptional merger N6240: 0.01% of L in the 2.2 μ line (all vib lines 0.1%?)
H2 v=1-0 S(1) 2.15μ in NGC 6240 van der Werf et al (2000) HST
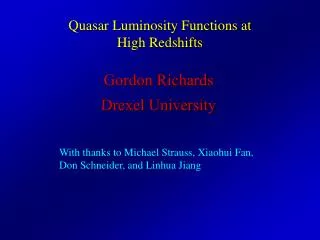
UV Lines of H2 • Absorption lines with FUSE • Very sensitive technique, down to column densities of NH2 1014 cm-2 • Ubiquitous H2 in our Galaxy (Shull et al 2000, Rachford et al 2001) translucent or diffuse clouds • Absorption in LMC/SMC reduced H2 abundances, high UV field (Tumlinson et al 2002) • High Velocity Clouds detected (Richter et al 2001)
Ly 4-0 FUSE Spectrum of the LMC star Sk-67-166 (Tumlinson et al 02) NH2 = 5.5 1015cm-2
R0/3 R0 Io Io*20 Column densities and molecular fraction compared to models
The CO Tracer • In galaxies, H2 is traced by the CO rotational lines • CO/H2 ~10-5 • CO are excited by collision with H2 • The dipole moment of CO is relatively weak • ~0.1 Debye • Spontaneous de-excitation rate Aul2 • Aul is low, molecules remain excited in low-density region about 300 cm-3
Competition between collisional excitation and radiative transitions, to be excited above the 2.7K background • J=1 level of CO is at 5.2K • The competition is quantified by the ratio Cul/Aul • varies as n(H2)T1/2 /( 32) • Critical density ncrit for which Cul/Aul = 1 • Molecule CO NH3 CS HCN • (Debye) 0.1 1.5 2.0 3.0 • ncrit (cm-3) 4E4 1.1E5 1.1E6 1.6E7
Various tracers can be used, CO for the wide scale more diffuse and extended medium, the dense cores by HCN, CS, etc.. The CO lines (J=1-0 at 2.6mm, J=2-1 at 1.3mm) are most often optically thick At least locally every molecular cloud is optically thick Although the "macroscopic" depth is not realised in general, due to velocity gradients Relation between CO integrated emission and H2 column density? Is it proportional? How to calibrate?
NGC 6946 CO(2-1) map 13" beam IRAM 30m Spectra, Weliachew et al 1988
Isotopic molecule 13CO, UV lines Statistics of "standard" clouds The Virial relation 1- Use the isotope 13CO much less abundant at the solar radius: Ratio ~90 therefore 13CO lines more optically thin A standard cloud in the MW has CO ~10 and 13 ~ 0.1 The average ratio between integrated CO and 13CO intensities is of the order of 10
Successive calibrations knowing 13CO/H2 ratio in the solar neighbourhood (direct observations of these lines in UV absorption in front of stars, with diffuse gas on the line of sight) 2- Statistically "standard" clouds For extragalactic studies, numerous clouds in the beam Typical mass of a cloud 103 Mo something like 104 or 105 clouds in the beam No overlap, since they are separated in velocity Filling factor fs fv << 1 (hypothesis) Usually TA* ~ 0.1K for nearby galaxies, 10K for a cloud constant factor between ICO and NH2
3- More justified method: the virial Each cloud contributes to the same TA* in average reflecting the excitation temperature of the gas the width of the spectrum gives the cloud mass through the virial hypothesis V2 r ~ GM The conversion ratio can then be computed as a function of average brightness TR and average density of clouds n
Milky Way Virial mass versus LCO Mvt=39LCO.81 Slope is not 1 Solomon et al 1987
Area A of the beam A = /4 (D)2 N clouds, of diameter d, projected area a= /4 d2 velocity dispersion V ICO = A-1 N (/4 d2)TR V Mean surface density NH2 = A-1 N (/6 d3) n NH2 / ICO = 2/3 nd/( TR V) from the Virial V ~ n1/2 d and the conversion ratio as n1/2 /TR
This factor is about 2.8 E20 cm-2 /(km/s) for TR ~10K and n~200cm-3 This simple model expects a low dependence on metallicity, since the clouds have high optical thickness and are considered to have top-hat profiles (no changes of sizes with metallicity) However, for deficient galaxies such as LMC, SMC, where clouds can be resolved, and the virial individually applied, the conversion factor appears very dependent on metallicity
The size of clouds, where = 1, is varying strongly Models with ~r-2, NH2 ~ r-1 Diameter of clouds d ~ Z (or O/H) Then filling factor in Z2 The dependence of the conversion ratio on metallicity could be more rapid than linear (the more so that C/O ~O/H in galaxies, and CO/H2 ~(O/H)2) In external galaxies, the MH2/MHI appears to vary indeed as (O/H)2 (Arnault et al 88, Taylor et al 1998)
Arnault, Kunth, Casoli & Combes 1988 LCO/M(HI) α (O/H)2.2
On the contrary, in the very center of starbursts galaxies, an overabundance of CO could overestimate the molecular content Not clear and definite variations, since TR is larger, but nH2 too, and NH2 / ICO varies as n1/2 /TR Possible chemical peculiarities in starbursts 12C primary element, while 13C secondary Isotopic ratios vary Can be seen through C18O
Another tracer: cold dust At 1mm, the emission is Rayleigh-Jeans B(, T) ~ 2 k T / 2 flux quasi-linear in T (between 20 and 40K) In general optically thin emission Proportional to metallicity Z Z decreases exponentially with radius
When the molecular component dominates in galaxies, the CO emission profile follows the dust profile (example NGC 891) When the HI dominates, on the contrary, the dust does not fall as rapidly as CO with radius, but follows more the HI (example NGC 4565) CO might be a poor tracer of H2
Radial profiles N891 (Guélin et al 93) & N4565 (Neininger et al 96)
The excitation effects combine to metallicity Explains why it drops more rapidly than dust with radius CO(2-1) line tells us about excitation Boarder of galaxies, CO subthermally excited When optically thick CO21/CO10 ratio ~1 If optically thin, and same Tex, could reach 4 But in general < 1 in the disk of galaxies Tex (21) < Tex (10) upper level not populated even if Tkin would have allowed them
Gradient of excitation in the LMC vs MW Sorai et al (2001) Average value of 0.6 for MW from Sakamoto et al 1995
Conclusion The H2 molecule is invisible, in cold molecular clouds (the bulk of the mass!) CO is not a good tracer, both because metallicity effect (non -linear, since depending on UV flux, self-shielding, etc. Very important to have other tracers dense core tracers, HCN, HCO+, isotopes.. H2 pure rotational lines, also a tracer of the "warm" H2, always present when cold H2 is there