Download
1 / 6
60 likes | 158 Views
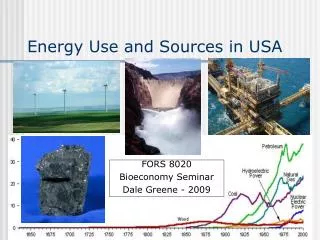
Explore Charlene Woodland's graph explaining the rise and fall of natural gas use in Connecticut from 1960 to 1989. Analyze if this trend aligns with the state's goal to reduce non-renewable resource consumption by 2010.

E N D
Energy Use in CT Charlene Woodland
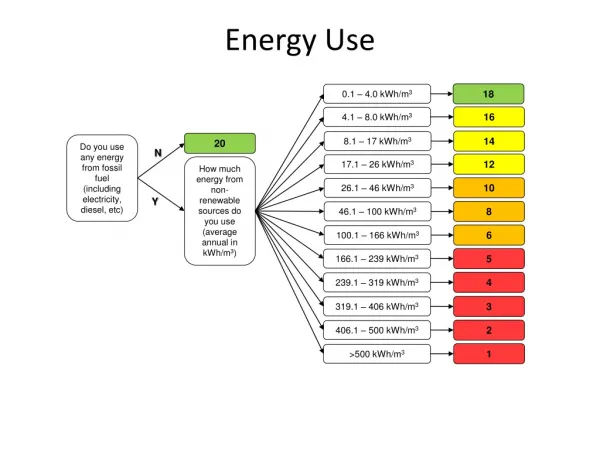
Graph Explained • The overall trend is that natural gas use has increased • Natural Gas Stay The Same Through 1960-1982 . • On 1983 Through 1989 It Was Up And Down.
Disadvantages • Natural gas is colorless , odorless , and tasteless.
Does this trend support Connecticut’s initiative to significantly decrease the use of non-renewable resources by the year 2010?