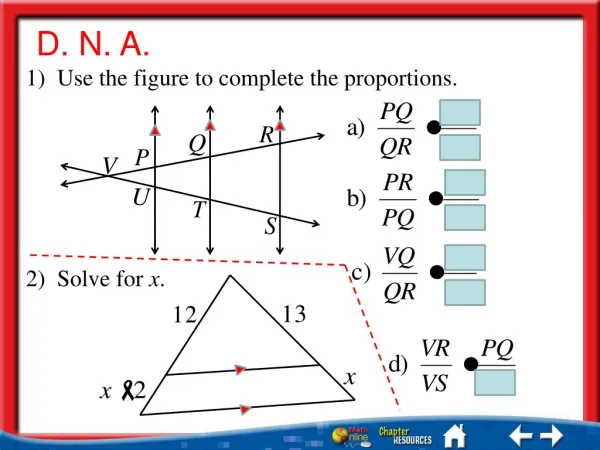
Supplementary Figures&Legends
Supplementary Figures&Legends. Figure1. Subcutaneous xenograft tumor models of the control group.

Supplementary Figures&Legends
E N D
Presentation Transcript
Supplementary Figures&Legends
Figure1. Subcutaneous xenograft tumor models of the control group.
Figure1. One of the subcutaneous xenograft tumor models in the control group.As shown in the picture, the width of the tumor is 10mm, and the tumor volume is about 1300mm3, which is the mean volume of tumors in control group.
Figure3. Subcutaneous xenograft tumor models treated with 10mg S(MeO)TLC. The tumor volume of mice in this group is varies, but the mean volume is lower than the control group significantly(P<0.05).
Figure4. Subcutaneous xenograft tumor models treated with 20mg S(MeO)TLC. The average tumor volume of mice in this group is significantly lower than the control group and the 10mg group(P<0.05). In addition, it is noted that there was necrosis on the tumor surfaces of some treated mice, especially in the 20 mg kg–1 S(MeO)TLC treatment group.