Download
1 / 10
100 likes | 120 Views
This article explores the current state of the soft drinks market, with a focus on the growing trend towards bottled water consumption. It discusses projections for the future, the impact on calorie intake, the attitudes of younger generations, sports consumption patterns, soda taxes, online consumer behavior, and potential advertising strategies.

E N D
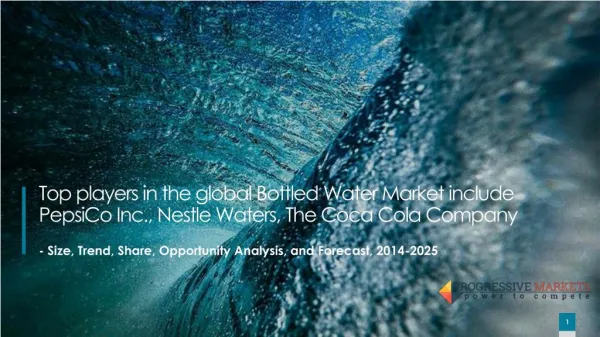
Drowning in a Flood of Bottled Water • The current state of the soft drinks market is closely tied to the bottled water trend, as Euromonitor projects that 2016 will be the first year the average American purchases more bottled water than carbonated sodas, or 27.4 gallons versus 26.2 gallons. • Euromonitor also forecasts that the gap will increase, with an average of 29.8 gallons of bottled water and 24.1 gallons of carbonated soda drinks (CSDs) by 2020. • This trend from carbonated sodas to bottled water is reflected in the Beverage Marketing Corporation’s (BMC) comparison of change in volume from 2014 to 2015, with CSDs declining 1.5% and bottled water increasing 7.9%.
Trillions of Fewer Calories • An extensive BMC study found that “Americans have saved from 61 to 68 trillion calories” from 2000 to 2015 by reducing their intake of CSDs and increasing the drinking of bottled water. This calculates to 67 to 74 fewer calories daily. • Nonetheless, Gary Hemphill, managing of director of research at BMC, stated that although bottled water consumption will surpass CSD consumption, CSDs “are likely to remain more popular than any other beverage for the foreseeable future.” • According to IRI, dollar sales for BFY beverages (bottled water, juice drinks, sports drinks and teas/coffees) in the convenience store channel increased 24.5% during the 52-week period ending mid-June 2016.
Youth’s Healthy Attitude • According to research from the US Centers for Disease Control and Prevention, 20% teens, which are the youngest segment of Generation Z, said they drank one or more sugar-sweetened beverage during 2015, compared to 27% during 2013. • A BMC/Fluent survey of college undergraduates, the oldest segment of Generation Z, found that 43% consume bottled water more than 7 times per week and 42% said they plan to drink more bottled water during the future. • Approximately 50% of the college undergraduates surveyed said they try to avoid artificial sweeteners, flavoring and preservatives, including high-fructose corn syrup, and 43% do so by reading labels regularly.
Soft Drinks and Sports Consumption • According to The Media Audit’s Fall 2015–Winter 2016 survey results for multiple US markets representing almost 48 million Americans, 58% of men 18+ consumed 10 or more soft drinks during the past 7 days compared to 42% of women 18+. • The data also revealed that 37.9% of men 18+ and 21.0% of women 18+ who usually drink non-diet soft drinks followed sports on radio during the past 12 months. The difference for following sports on TV was 81.6% and 64.2%, respectively. • For men and women 18+ who usually drink diet soft drinks, more men than women, followed sports on radio, 46.1% and 27.7%, respectively, but the gap was narrower for those who followed sports on TV, at 87.6% and 75.7%, respectively.
A “Sweet” Tax • Berkeley, CA is one of a number of US cities that has imposed a soda tax. An August 2016 study found that consumption of sugar-sweetened beverages decreased 21% during the year since the tax went into effect during 2014. • During June 2016, Philadelphia’s city council approved a 1.5 cents-per-ounce tax for most sugary and diet beverages. The tax is expected to generate $91 million per year that will be added to the city’s public school system budget. • The American Beverage Association, however, says it will file a lawsuit against the city, because it interprets the tax as a violation of Pennsylvania state law, which doesn’t allow a local government to impose such a tax in addition to the statewide sales tax.
Soft Drink Consumers on the Internet • According to NetBase’s June 2015 to June 2016 study of more than 84 million Internet mentions about food and beverage brands, five beverage brands ranked in the top 10: Budweiser, #2; Red Bull, #3; Coca-Cola, #5; Pepsi, #6; and Mountain Dew, #9. • The Media Audit’s Fall 2015–Winter 2016 survey results reveal that more than twice as many men 18+ who drink non-diet soft drinks (44.8%) than those who drink diet soft drinks (20.8%) logged onto Facebook, Twitter and YouTube during the past month. • The difference among women 18+ in these two categories of soft drink consumers and those who logged onto Facebook, Twitter and YouTube during the past month was 61.2%, at 37.4% and 23.2%, respectively.
Advertising Strategies • A possible retail campaign is a “Balance Your Intake” promotion where consumers receive a discount to buy soft drinks with a qualifying purchase of bottled water or vice versa, or receive a free bottle of the opposite kind to promote future purchases. • Retailers can certainly use The Media Audit data to target men more than women to market non-diet soft drinks according to their sports consumption. • The Media Audit data also reveal opportunities for retailers to target women during early morning and late afternoon on TV with special offers, specifically for diet soft drinks.
New Media Strategies • Although fewer consumers may be drinking soft drinks, especially non-diet brands, retailers can promote purchases by sharing recipes online in which soft drinks are an ingredient, such as a barbecue sauce sweetened with a soft drink. • Similarly, retailers can promote the many opportunities to use soft drinks as an adult beverage mixer. • Social media content can explain how consumers can enjoy the health benefits of bottled water and other healthy beverages as well as soft drinks by choosing soft drinks for special occasions, such as celebrations, cookouts, etc.