Download
1 / 13
130 likes | 330 Views
Bottled Water. Students Promoting Environmental Awareness and Responsibility February 16, 2009. The Bottled Water Craze Is Upon Us!. Why do people ♥ bottled water?. Taste, Color, and Odor. Varies based on minerals present Tap water varies greatly by region and season

E N D
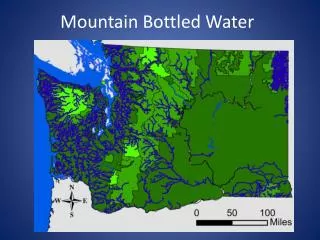
Bottled Water Students Promoting Environmental Awareness and Responsibility February 16, 2009
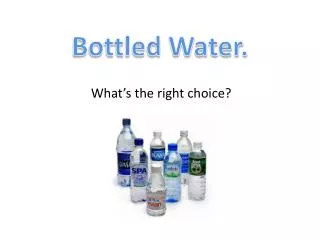
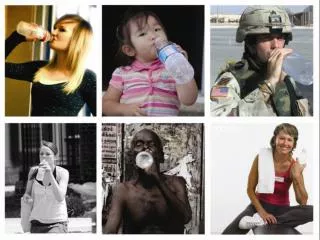
The Bottled Water Craze Is Upon Us! Why do people ♥ bottled water?
Taste, Color, and Odor • Varies based on minerals present • Tap water varies greatly by region and season • Bottled water flavor can be affected by type of plastic • Temperature affects taste • Taste is less noticeable in ice-cold water than warm water
Quality and Safety • Regulated by FDA and EPA • Specific guidelines for testing and maximum amounts of minerals/contaminants • Tap water often has stricter standards than bottled water • Taste, odor, and color don’t always indicate if water is healthy or not • Sulfur affects smell and taste but is safe • Some harmful contaminants have no color, taste, or odor
Source of Bottled Water • 25%-30% of US bottled water are “bottled tap water” • e.g. Dasani, Aquafina • Labels must include “from a municipal source” or “from a community water system” if tap water is not further treated • Some simple, ineffectual treatments eliminate the labeling requirement
Economic Impact • US bottled water consumption (2005) • 30 gal / person / year • $15 billion / year • Prices: $1 to $180 per gallon
Environmental Impact • Plastic water bottles are made from • PET (polyethylene terephthalate; ♳) • Derived from crude oil • HDPE (high-density polyethylene; ♴) • Milk containers • Polycarbonate (part of ♹) • Nalgene bottles • Eyeglasses
PET ♳ • 2,713,000 tons sold in 2006 • Less than 1/3 of 1% of total US waste (IBWA; no references) • About 76% is not recycled
HDPE ♴ • 1,755,000 tons sold in 2006 • About 73% is not recycled
Sustainability Efforts • US: container deposit legislation (“bottle bill”) • About 30% of US population affected (2004 Census) • Campaigns • UNICEF’s Tap Project • Think Outside the Bottle • Inside the Bottle
Sources • Larson J. Bottled water boycotts: back-to-the-tap movement gains momentum. Earth Policy Institute. 2007. Available at: http://www.earth-policy.org/Updates/2007/Update68.htm [Accessed February 14, 2009]. • Napier GL, Kodner CM. Health Risks and Benefits of Bottled Water. Primary Care: Clinics in Office Practice. 2008;35(4):789-802. • Olsen E. Bottled water: pure drink or pure hype? Natural Resources Defense Council. 1999. Available at: http://www.nrdc.org/water/drinking/bw/chap2.asp [Accessed February 14, 2009]. • Wikipedia contributors. Container-deposit legislation. In: Wikipedia, The Free Encyclopedia. Wikimedia Foundation; 2009. Available at: http://en.wikipedia.org/w/index.php?title=Container-deposit_legislation&oldid=267695407 [Accessed February 16, 2009].