C:_
1. 2. 3. 4. 5. 6. 7. 8. 9. 10. 11. 12. 13. 14. 15. 17. 18. 19. 20. 21. Copy Number. A NGS Library: Target region capture/quality analysis. B NGS Library: Customized normalization and filtering pipeline. chr 25, 100K windows. chr 25, 10K windows.

C:_
E N D
Presentation Transcript
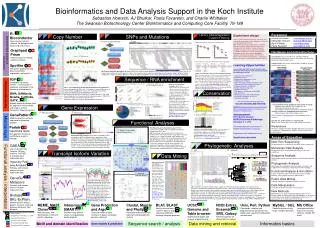
1 2 3 4 5 6 7 8 9 10 11 12 13 14 15 17 18 19 20 21 Copy Number ANGS Library: Target region capture/quality analysis BNGS Library: Customized normalization and filtering pipeline chr 25, 100K windows chr 25, 10K windows Sequence / RNA enrichment_ 1 = TnonMet 2 = TMet B “C-terminal region” AS Hydrophobicity AA scale V V POSTN(Hs) Domains / sites A ss EMI FAS1 FAS1 FAS1 FAS1 D C Transcript isoform discovery using Affymetrix exon arrays:(A) Differential isoform expression for Sh3pxd2a / Tks5 between metastasizing and non-meta-stasizing tumor samples was discovered in exon array data using Partek software and BCC-devised tools. The finding was bolstered by public transcript sequence evidence (B,C) and tissue panel exon array data (D), and was later confirmed experimentally. Note that isoform discovery is also becoming feasible via specialized RNAseq protocols. (Monte Winslow, Jacks Lab) Functional analysis / interpretation Phylogenetic Analyses Tetrapod exon 18 (7 sequences) Hs Mm Oa Md Gg Tetrapod exon 19 (7 sequences) Ac Xt Dr_loc1 Ol_loc1 Ga_loc1 Tr_loc1 Tn_loc1 Teleost exon “18=19” 13 aa repeat (45 sequences) Dr_loc2 Ga_loc2 Tr_loc2 Tn_loc2 Web interface Graphical User Interface, e.g. JAVA Command line interface Free to use for everyone User account through BCC On dedicated BCC computers www gui C:_ F Data mining and retrieval A N Bioinformatics and Data Analysis Support in the Koch Institute Sebastian Hoersch, AJ Bhutkar, Paola Favaretto, and Charlie Whittaker The Swanson Biotechnology Center Bioinformatics and Computing Core Facility, 76-189 Statistical data analysis & visualization R / Bioconductor Open-source statistics software for biological data processing and analysis. C:_ F Personnel Charlie Whittaker (charliew@mit.edu) Sebastian Hoersch (hoersch@mit.edu) Arjun Bhutkar (arjun@mit.edu) Paola Favaretto (paolaf@mit.edu) Personnel _ SNPs and Mutations Library Characterization, Custom Filtering- Experiment design Like any good experiment in biology, microarray and sequencing experiments require replication to allow for any meaningful data analysis. With modern massively parallel platforms (Illumina, Affymetrix, Agilent) and experienced processing (Biopolymers Core, BioMicroCenter), biological variability will always surpass technical variability. It is therefore imperative to design microarray and sequencing studies that comprise biological replicates. We greatly encourage researchers to discuss their experiment design with us, especially in problematic cases, e.g. when RNA quantity is limited. A B A Variant analysis workflow B IGV Sample G2_2.4, aCGH data Graphpad Prism Powerful and user-friendly statistics software gui N Hardware and Infrastructure • Hardware and Infrastructure • rous.mit.edu: Linux cluster (96 cores, 304 GB of RAM) for computationally and memory-intensive tasks. Also hosts the facility wiki and the KI GenePattern server. • rowley.mit.edu:Isilon cluster (7xNL36 nodes for 200 Tb) for data storage and file serving • 1 Tb of network storage available to each lab free of charge • Additional space available at an inexpensive rate • Stored data is backed-up and secure • Shared folders are accessible from any networked computer • Cluster accounts are available for all KI researchers • Well maintained and reliable compute cluster • Contact Charlie (charliew@mit.edu) to take advantage of these resources • luria.mit.edu, ccrbi1.mit.eduand ccrbi2.mit.edu:Apple servers used for web servers, data storage and analysis. • Workstations • 76-189 has a public workspace equipped with two PCs that can be used to access GraphpadPrism, Spotfire, Partek Genomics Suite, and Oncomine. Sample G2_2.4, sequencing data Spotfire Interactive, graphics-based data visualization, exploration, and analysis. • Learning Opportunities • In association with MIT Libraries the BCC offers training in bioinformatics each January during IAP. Potential topics include: • Making the most of MS Excel • Introduction to Unix • Bioinformatics Applications of Unix • Introduction to Scripting • Galaxy and UCSC Genome Informatics Tools • Transcription Factor Binding Site Analysis • Relational databases and MySQL • Multiple Sequence Alignment • Phylogenetic Analysis • NGS aligners - Introduction to SAM/BAM • Statistics with R • Microarray analysis with R/Bioconductor • Functional Annotation of Gene Lists • Introduction to Matlab • See our instructional material on the wiki: • rous.mit.edu/index.php/Teaching/ • !!!NOTE!!! Individual instruction in any bioinformatics topic is available upon request. Just contact us to arrange for a training session. • Announcement : MIT Libraries presents NCBI Discovery Workshops December 6 -7, 2011 • The workshops will cover many of NCBI’s bioinformatics resources. • Registration and additional info at: • libguides.mit.edu/ncbimit gui N C NGS variant detection procedure:(A) Input material can either be whole-genome or transcriptome isolate, or a selected subset such as the exome (exon capture) or specific genome regions. Raw sequences are pre-processed and aligned using various options (BWA or Bowtie). SAMtools is used to call variants. (B)IGV is used to visualize the alignments in the context of the genome and its associated annotations. Library characterization and custom normalization/filtering: (A) Percentage target bases (Y axis) covered at varying levels of NGS read coverage depth (X axis) at differing levels of read mapping quality, mouse lung adenocarcinoma dataset. Various customized filtering steps implemented to improve signal/noise ratio. Coverage metrics derived using the Picard toolset. Graphs show % covered bases (left) and % callable bases in a tumor-normal comparison (right) (David McFadden, Jacks Lab). (B) Customized implementation of a normalization and filtering pipeline for NGS Ago2-CLIP dataset prior to enrichment analysis (Anthony Leung/Amanda Young, Sharp Lab). IGV “Integrative Genomics Viewer” – Visualization of alignment information in the context of chromosomes. Illumina sequencing gui F ACustomized strategy: Sub-sequence enrichment in mESC datasets CMultiplexed shRNA screens: Enrichment/Depletion Analysis Data-specific enrichment strategies: (A) Custom implementation for determining sub-sequence enrichment by statistical overrepresentation in NGS datasets, using an enumerative approach. Used here to determine enrichment of miRNA target sites in 3’ UTR and CDS mapped read clusters. (B) mature miRNA population analysis in NGS dataset and correlation with corresponding target site enrichment statistic. (C) Enrichment/Depletion analysis for NGS shRNA screen datasets. Multiplexed/barcoded libraries are mapped to partial hairpin sequences using an exact and “fuzzy-matching” approach. (A,B: Anthony Leung/Amanda Young, Sharp Lab; C: Corbin Meacham, Hemann Lab) (A) An Agilent CGH array for the zebrafish (Daniorerio) genome was custom-designed at the BCC with ~15K probes to study peripheral nerve sheath tumors and (B)aCGH results were confirmed using Illumina sequencing (Zhang et al, 2010;Hopkins/Lees Lab). (C) Sequencing data allow “switching to” a higher resolution (10K, right) than available on the array and used for evaluation purposes (100K, left), and are generally more powerful and versatile. Continuing studies are using the Illumina platform exclusively. Conservation BWA, SAMtools, Bowtie, Cufflinks, GATK... Rapidly evolving software tools for alignment and assembly and analysis of Next Generation Sequencing data. AMotif and flanking region conservation C:_ F BPopulation analysis and target enrichment correlation Gene Expression A RNAseq workflow B Microarrays GenePattern Modular genomics analysis and general computing platform. Microarrays gui F BTarget/Cleavage site conservation analysis Functional Analyses Enrichment Score PartekGenomics Suite Multi-platform microarray and RNAseqanalysis package. Log ratio gui N Functional analysis of genomics data:Different avenues are available at BCC to provide a functional interpretation of the data.(A) Gene groups can be examined for enrichment of binding sites of transcription factors using Biobase Explain. Shown here is a frequency profile of p53 binding sites around the transcription start site of gene group of interest.(B – D) Pathway analysis. In addition to Biobase (B), the BCC provides access to GeneGO (C) and Ingenuity (D). These tools allow gene groups to be analyzed in the context of known gene networks and pathways and differences in the underlying proprietary data are likely to make the tools complementary rather than redundant. A Biobase Transcription Factor Binding Sites Sequence conservation analysis: (A) Conservation analysis of motif instances (matches to motif log-odds matrix) across various libraries against a set of randomized background replicates with similar nucleotide composition (Anthony Leung/Amanda Young, Sharp Lab). (B) Sequence conservation of Mdm2 cleavage site across vertebrate species. (Trudy Oliver, Jacks Lab). B statistic Gene expression analysis can be done using RNAseq and microarrays. (A) The RNAseq analysis pipeline has been implemented and the method is gaining popularity as sequencing becomes more affordable. Benefits include flexibility with level of detail collected and a lack of platform-dependent biases. (B) Microarrays are still a viable alternative to genome-wide mRNA analysis. They are generally less expensive and benefit from routine and well-developed processing and analysis methods. Areas of Expertise Areas of Expertise Next-Gen Sequencing Design and analysis of experiments based on Illumina sequencing. Microarray Data Analysis Design and analysis of hybridization-based gene expression experiments. Sequence Analysis Understanding poorly characterized genes and minimally annotated genomes. Phylogenetic Analysis Identification of evolutionarily conserved regions or residues and establishment of evolutionary relationships between homologs. Functional Analysis & Annotation Analysis of genomics data in the context of function, including pathways, gene networks, and transcription factors. Public Data Mining Thorough and efficient exploitation of public resources. Data Manipulation Automation of repetitive and time-consuming tasks. New Methods Bioinformatics is a rapidly changing discipline and we strive to provide support in novel and emerging methodologies. If you hear of something involving computers and biology and want to use it in your research, let us know and we will try to help. gui F GSEA and similar tools like Gominer, GOtree machine, GATHER to interpret gene expression data. BGeneGoMetaCore www A ticrr B periostin Transcript Isoform Variation. Data Mining. Ingenuity Path-way Analysis Pathway and network analysis of gene expression data. Public data retrieval and mining:For a project aiming at the identification of cell surface markers, the Human Protein Atlas (Uhlénet al, 2005), was systematically queried for cancer-specific expression across a range of solid tumors. Data aggregation, scoring, and cross-indexing for likely cell surface expression was done at the BCC, creating functionality not present in the original resource. (Richard O. Hynes, in collaboration with MIT’s Department of Materials Science and Engineering). gui A CIngenuity Pathway Analysis GeneGo Metacore Pathway and network analysis of gene expression data. A www (A) PSI-BLAST, an iterative BLAST variant, enables the detection of remote homologs of the gene ticrr via a interactive, hit-dependent adaptation of a position-specific scoring matrix (PSSM). Here, 3rd iteration PSI-BLAST output is post-processed into a quasi-multiple sequence alignment using MView (Brown et al, 1998), allowing for the identification of conserved regions directly from BLAST output (Sansamet al, 2010; Hopkins/Lees Lab).(B)Periostin (POSTN), an extracellular matrix protein often found upregulated in epithelial cancers, has a C-terminal alternatively spliced low-complexity region with a poorly understood function. Phylogenetic analyses showed the presence of two periostinparalogs in teleost fish and demonstrated that this region is homologous to a 13 amino-acid repeat sequence well conserved in an unusually large C-terminal periostin exon (“18=19”)in teleosts (Hoersch and Andrade-Navarro, 2010). Biobase BKL-ExPlain, Microarray data analysis, protein, literature, motif and pathway databases from Biobase. A www C:_ F Clustal, Muscle and Phylip Publication quality sequence alignment and phylogenetic analysis. MEME, MAST, Clover … Motif discovery and identification in DNA and protein sequences. Interproscan, SMART… Genome-scale domain analysis and publication quality graphics. Gene Prediction and Argo Characterization of gene structures in poorly annotated genome sequence. BLAT, BLAST Identity and similarity searches against large sequence collections including complete genomes UCSC Genome and Table browser Sophisticated display and analysis of genomic data. NCBI Entrez, Ensembl, SRS, Galaxy Advanced queries for efficient data extraction. Unix, Perl, PythonCommands, scripting and programming for job control, text processing, sequence manipulation and web tools. MySQL / SQL Powerful queries of very large / complex datasets. MS Office Leverage advanced features of common software, notably MS Excel. F www F F C:_ F www gui F www F www www www F gui C:_ Motif and domain identification Gene models & prediction Sequence search / analysis Informatics basics