Download

1 / 29
290 likes | 473 Views
Introduction. Human disturbance and predation thought to contribute to low reproductive successLittle focus on causes of nest failure and chick lossDavis et al. (2001)ID of 40% predators unknownGeorge (2001)causes of 47% of failures unknown. Introduction. Evidence that traditional methods of id

E N D
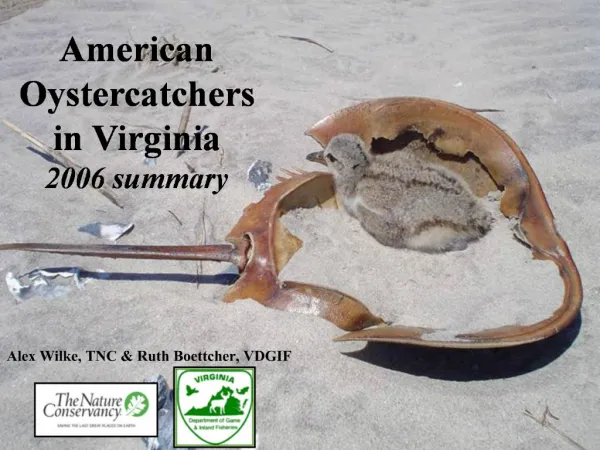
1. Effects of Human Disturbance and Predation on American Oystercatchers During the Breeding Season, Cumberland Island, Georgia John Sabine
Warnell School of Forest Resources
University of Georgia
2. Introduction Human disturbance and predation thought to contribute to low reproductive success
Little focus on causes of nest failure and chick loss
Davis et al. (2001)
ID of 40% predators unknown
George (2001)
causes of 47% of failures unknown
3. Introduction Evidence that traditional methods of identifying nest predators unreliable
ID 57% incorrect (Williams and Wood 2002)
Correct information vital for effective management
4. Objectives Determine nest success
Determine depredation percentages and sources
Determine disturbance frequency and duration and its effects on nesting success
Quantify threshold of tolerance to disturbance
5. Study Site Cumberland Island National Seashore
28-km barrier island
Oceanfront beach
6. Study Site 42,265 visitors in 2002, plus boaters
Disturbance limited to southern half of island
Forms of disturbance
pedestrian, vehicles, ATV traffic, boat traffic, and pets
7. Methods Nests located by pedestrian surveys
Document nest site
Install video monitoring equipment
Begin collecting activity budget data
8. Methods Video Monitoring used for nest failure determination
black and white IR camera
placed 2 m from nest
time lapse recorder and 12V battery
Battery and recorder placed 15 m from nest
VHS tape and battery replaced every 2-3 days
Continuous record of nest activity
9. Methods Activity budget data (Baldassarre et al. 1988)
collected for nesting adults
30 min/bird
recorded instantaneous activity every 15 sec
19 activity categories
distance from nest/chick
Disturbance to subject recorded simultaneously
type of disturbance
distance to subject (<300 m)
Recorded habitat use in 2004
surf, intertidal, wrack, foredune, dune, marsh
10. Methods Pass-by Experiment
Pedestrian walk-by
20, 40, and 60 m
Vehicle drive-by
at high tide line
ATV drive-by
at high tide line
Record distance at which bird flushed from nest
11. Results Banding in 2004
4 individuals banded
Used decoy method
12. Results 2003
11 nesting pairs
19 nest attempts
4 pairs fledged 6 chicks
Estimated daily survival 0.9732* (95% CI = 0.9598 - 0.9866)
13. Results 2004
10 nesting pairs, 1 non-nesting pair
13 nest attempts
5 pairs fledged 9 chicks
Estimated daily survival 0.9846 (95% CI = 0.9740 - 0.9952)
14. Results No difference* (P = 0.1892) between years
Combined years estimated survival 0.9787 (95% CI = 0.9701 - 0.9873)
Total of 32 nest attempts
9 attempts successful, fledging 15 chicks
15. Results North End
5 nesting pairs
Daily survival 0.9899 (95% CI = 0.9819 - 0.9979)
7 of 13 successful
South End
6 nesting/5 nesting, 1 non
Daily survival 0.9648 (95% CI = 0.9484 - 0.9813)
2 of 19 successful
Difference (P = 0.0072) between regions
16. Results Identified 18 0f 20 nest failures during incubation
Chicks very difficult to monitor
1 of 8 losses identified
Causes of Nest Failure
Predation (14)
Raccoon (9)
Bobcat (3)
Crow (1)
Ghost crab (1)
Human (1)
Horse Trampling (1)
Overwash (1)
Abandoned (2)
Unknown (2)
17. Results North End
2 raccoons
1 ghost crab
1 crow
4 depredation events
South End
7 raccoons
3 bobcats
1 human
1 horse
12 depredation events
18. Results Activity and Disturbance Data
More than 750 hrs of observation
Data available...
19 attempts during incubation
11 attempts during brood rearing
19 activity categories reduced to 5
19. Results Multivariate Analysis of Variance (MANOVA)
Predictor variables
disturbance (pedestrian only!), temperature, tide
Response variables
5 activity categories
locomotion, self-maintenance, reproduction, vigilance, alarm
Analysis not complete
22. Results Pass-by Experiment
No difference between pedestrian treatments
Some differences between nests, but no pattern found
23. Results Pooled Pedestrian pass-by data for each nest
Calculated mean of nest means and 95% CI
113 m, upper 95% CI of 137 m
Used this for disturbance determination
24. Conclusions North End successful, South End not. WHY?
Human disturbance low on North End
North End may be isolated from mammalian predators
High quality foraging habitat nearby
25. Conclusions Predation primary cause of nest failure
Higher on South End. WHY?
Human presence on south end supporting larger population of mammalian predators
Human presence on beach encouraging scavengers to use beach
Nesting habitat closer to mammalian predator habitat
26. Conclusions Tolerant to disturbance to ~137 m radius
Expected differences between pass-by distances
Low sample size, high variation may have contributed to lack of significance
ATVs, vehicles and boats appear to have little effect on activity
that doesn�t mean they�re not a problem!
27. Still to Come...
How human disturbance effects activity
What Next?
How do we keep a closer watch on chicks?
What happens after fledging?
What factors are involved in reproductive success?
How does foraging habitat contribute to reproductive success?
Who gets the best nesting and foraging habitat? Why?
28. References Baldassarre, G., S. L. Paulas, A. Tamisier, and R. D. Titman. 1988. Workshop summary: techniques for timing activity of wintering waterfowl. Pages 181-188 in Waterfowl in Winter (M.W. Weller, Ed.). University of Minnesota Press, Minneapolis, MN.
Davis, M. B., T. R. Simons, M. J. Groom, J. L. Weaver, and J. R. Cordes. 2001. The breeding status of the American Oystercatcher on the east coast of North America and breeding success in North Carolina. Waterbirds 24:195-202.
George, R. C. 2001. Reproductive ecology of the American Oystercatcher (Haematopus palliatus) in Georgia. Thesis, University of Georgia, Athens, GA.
Hines, J. E. 1996A. MAYFIELD software to compute estimates of daily survival rate for nest visitation data. USGS-PWRC. http://www.mbr-pwrc.usgs.gov/software/mayfield.html.
Hines, J. E. 1996B. CONTRAST software to compare estimates of survival. USGS-PWRC. http://www.mbr-pwrc.usgs.gov/software/mayfield.html.
Williams, G. E., and P. B. Wood. 2002. Are traditional methods of determining nest predators and nest fates reliable? An experiment with wood thrushes (Hylocichla mustelina) using miniature video cameras. Auk 199:1126-1132.