Download
1 / 71
1.34k likes | 2.97k Views
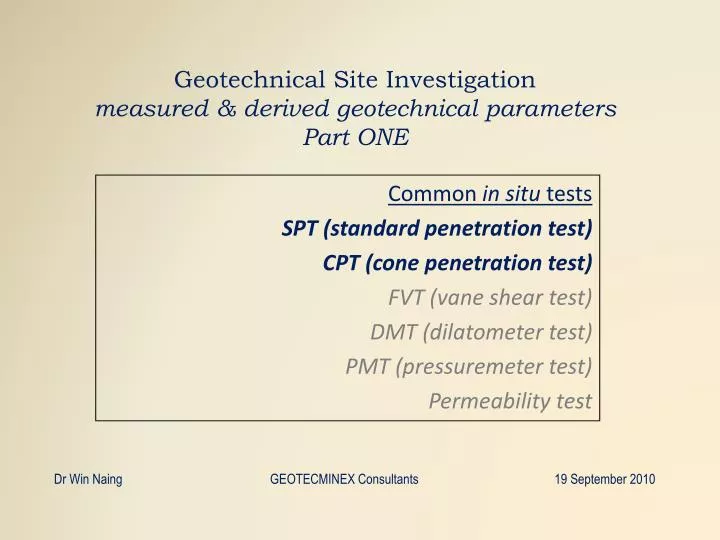
Geotechnical Site Investigation measured & derived geotechnical parameters Part ONE. Common in situ tests SPT (standard penetration test) CPT (cone penetration test) FVT (vane shear test) DMT (dilatometer test) PMT (pressuremeter test) Permeability test.

E N D
Geotechnical Site Investigationmeasured & derived geotechnical parametersPart ONE Common in situ tests SPT (standard penetration test) CPT (cone penetration test) FVT (vane shear test) DMT (dilatometer test) PMT (pressuremeter test) Permeability test Dr Win Naing GEOTECMINEX Consultants 19 September 2010
The Purpose • To fully understand the tasks we are carrying out Standard Penetration Test: it is a very boring job; it is so simple any one can do it. SPT should be carried out properly so that the result will approximately reflect the undrained shear strength of soil and soft-rocks. • To be aware of derived parameters used as engineering design parameters SPT –N needs to be corrected (N60 , N1(60))to obtain derived geotechnical design parameters • To appreciate the basic foundation engineering design methods ASD: allowable stress design LRFD: load & resistance factor design MGSS/workshop Dr Win Naing
ASD vs LRFD Allowable Stress Design (ASD) ASD: Rn/FS ≥ ∑Qi Resistance ≥ Effects of Loads Limitations • Does not adequately account for the variability of loads and resistance • Does not embody a reasonable measure of strength • Subjective selection of factor of safety Load and Resistance Factor Design (LRFD) LRFD: R = φ Rn ≥ ∑ηi γi Qi = Q Limitations • Require the availability of statistical data and probabilistic design algorithms • Resistance factors vary with design methods • Require the change in design procedure from ASD MGSS/workshop Dr Win Naing
Explanation Where Rn = nominal strength (e. g., ultimate bearing capacity) ∑Qi = nominal load effect FS = factor of safety Rn = nominal resistance φ = statistically-based resistance factor ηi = load modifier to account for ductility, redundancy and operational importance γi = statistically-based load factor Qi = load effect. MGSS/workshop Dr Win Naing
LRFD: load & resistance factor design LRFD approach applies separate factors to account for uncertainties in loads and resistances based on the reliability theory. Reliability-based design takes into account the statistical variability by using the mean and the standard deviation (or the coefficient of variation) of all loads and resistance parameters. Given a set of loads and resistance parameters the process can calculate the “probability of failure”. In the LRFD method, external loads are multiplied by load factors while the soil resistances are multiplied by resistance factors. LRFD recognizes the difference in statistical variability among different loads by using different multipliers for different loads. Load and resistance can be modeled by a normal or log normal probability density function based on its distribution characteristics. MGSS/workshop Dr Win Naing
SPT-N, N60, N1(60), N1(60)sc& derived parameters MGSS/workshop Dr Win Naing
Standard Penetration Test Rotary-drilled Borehole Standard Penetration Test (SPT) N = measured Number of Blows to drive sampler 300 mm into soil. MGSS/workshop Dr Win Naing
Typical SPT-N & N60 in FILL, Marine CLAY and OA MGSS/workshop Dr Win Naing
SPT-N and N60 in reclamation area (Sand FILL and OA) at Changi East MGSS/workshop Dr Win Naing
SPT-N & N60 in CLAY, fine SAND, medium SAND , coarse SAND and Siltstone (Yangon) MGSS/workshop Dr Win Naing
The meaning of SPT- N value SPT- N value in sandy soil indicates the friction angle in sandy soil layer SPT- N value in clay soil indicates the stiffness the clay stratum
Correlation between Fiction Angle (f ) & SPT-N Value Hatakanda and Uchida Equation (1996) f = 3.5 x (N) 0.5 + 22.3 where, f = friction angle N =SPT value Note: This equation ignores the particle size. Most tests are done on medium to coarse sands Fine sands will have a lower friction angle.
Correlation between Friction Angle (f) SPT(N ) Valuecontd. Hatakanda and Uchida Equation (1996) Modified f = 3.5 x (N) 0.5 + 20 fine sand f = 3.5 x (N) 0.5 + 21 medium sand f = 3.5 x (N) 0.5 + 22 coarse sand where, f= friction angle N =SPT value Hatakanda, M. and Uchida, A., 1996: Empirical correlation between penetration resistance and effective friction angle of sandy soil. Soils and Foundations 36 (4): 1-9
Peck, R. et al., 1974. Foundation Engineering. John Wiley & Sons, New York f = 53.881-27.6034. e-0.0147N Where, N = average SPT value of strata (soil layer) MGSS/workshop Dr Win Naing
Johnson, S. M, and Kavanaugh, T. C., 1968. The Design of Foundation for Buildings. McGraw-Hill, New York. SPT vs. Coefficient of sub-grade reaction MGSS/workshop Dr Win Naing
ASD: allowable stress design based on SPT-N Qallowable = 1.5 N ksf (Meyerhoff, 1956), 1.0 N ksf (Terzaghi and Peck, 1967), 0.37 N ksf (Strounf and Butler, 1975), and 0.5 N ksf (Reese, Touma, and O’Neill, 1976) (1 ksf = 47.88 kPa) • All these empirical formulas for the allowable end bearing capacity were proposed by different researchers and practitioners assuming a factor of safety of 2.5. • All uncertainty is embedded in the factor of safety (FS). • These formula gears towards ASD, for it predicts the allowable soil and rock resistances using the SPT blow count (N) alone. • Allowable stress design (ASD) treats each load on a structure with equal statistical variability. MGSS/workshop Dr Win Naing
Allowable bearing pressure for footing of settlement limited to 25 mm(Bowles, 1982) MGSS/workshop Dr Win Naing
Rule of thumb methods to compute bearing capacity Bearing capacity of FINE SAND: Allowable bearing capacity (kPa) = 9.6 Naverage(not to exceed 380 kPa) = 0.2 Naverage(not to exceed 8 ksf) Procedure Step 1. Find the average SPT-N value below the bottom of footing to a depth equal to width of the footing. Step 2. If the soil within this range is fine sand, the above rule of thumb can be used. MGSS/workshop Dr Win Naing
Rule of thumb methods to compute bearing capacitycontd. Bearing capacity of Medium to Coarse SAND: Allowable bearing capacity (kPa) = 9.6 Naverage(not to exceed 575 kPa) = 0.2 Naverage (not to exceed 12 ksf) Procedure Step 1. Find the average SPT-N value below the bottom of footing to a depth equal to width of the footing. Step 2. If the soil within this range is medium to coarse sand, the above rule of thumb can be used. Note: if the average SPT-N value is < 10, soil should be compacted. MGSS/workshop Dr Win Naing
SPT-N corrections MGSS/workshop Dr Win Naing
Corrected SPT: N60& N1(60) N60= Nm x CE x CS x CB x CR N1(60) = CNx N60 Where, Nm = SPT measured in field CN = overburden correlation factor = (Pa/s’)0.5 Pa = 100 kPa s’ = effective stress of soil at point of measurement CE = energy correlation factor for SPT hammer, safety hammer(0.6 – 0.85); donut hammer (0.3-0.6); automatic hammer (0.8-1.0) CB = borehole diameter correction, 65 – 115 mm (1.0); 150 mm(1.05); 200 mm (1.15) CR = rod length correlation, <3m (0.75); 3 – 4m, 0.8, 4-6m, 0.85; 6-10m, 0.95; 10-30m, 1.0)(i.e., adjustment for weight of rods) Cs = sampling method, standard sampler (1.0); sampler w/o liner (1.1-1.3) MGSS/workshop Dr Win Naing
Bearing capacity methods using N60 Meyerhof, 1976 (based on 25mm settlement) qa = N60.Kd/F1 B£F4 qa = N60.Kd.(B+F3)/(B.F2) B>F4 where Kd=1+Df/(3B)£1.33, F1 to F4 defined as SI units: • F1=0.05 , F2=0.08 , F3=0.30, F4=1.20 • N60 = average SPT blow counts from 0.5B above to 2B below the foundation level. MGSS/workshop Dr Win Naing
Bearing capacity methods using N60 (contd.) Burland and Burbidge, 1985 (based on 25 mm settlement) qa =2540.N601.4/(10T.B0.75) Where N60 = average SPT blow counts to a depth of B0.75 below footing T~2.23 Parry, 1977 (based on 25mm settlement) The allowable bearing capacity for cohesionless soil qa=30N60 Df£B Where N60 = average SPT blow counts below 0.75B underneath the footing. MGSS/workshop Dr Win Naing
General Terzaghi Formula The following Terzaghi equation is used for indirect estimation of bearing capacity of shallow footing on cohesionless soil. qult= (qNq)+(0.5gBNg) where: q = the overburden stress at foundation level (Df). Nq = e [p.tan(f)][tan(p/4+f/2)]2Bowles 1996 Ng= 1.5(Nq-1).tan(f) Brinch & Hansen 1970 f = friction angle correlated by Hatanaka and Uchida (1996) equation, based on SPT at foundation level MGSS/workshop Dr Win Naing
N1(60) Peck, 1974 Allowable bearing capacity using N1(60) qa =10.6N1(60) N1(60)=Cn.N60 MGSS/workshop Dr Win Naing
Example computation using a SPT program (NovoSPT pro 2.1.035)SPT data: Marina South • A shallow foundation is placed on SAND • The footing depth (Df) is 4.15 m below ground level (where sand layer starts) • The footing width (B) is 1.0 to 3.0 m • Shear Failure Safety Factor is 3.0 Note: Safety factor is applied only to Terzaghi method. Others are based on 25 mm settlement. Soil parameters • f (Hatanaka & Uchida, 1996) = 32.1 • Nq (Bowles, 1996) = 23.45 • Ng (Brinch & Hansen, 1970) = 21.12 • N60 = 7; N1(60) = 8 • Effective stress at Df (kPa) = 76.91 MGSS/workshop Dr Win Naing
Bearing Capacity (kPa) resultsfor comparison MGSS/workshop Dr Win Naing
End bearing capacity of piles in sandy soil q = c x N (MN/m2) q = 20.88 x c x N (ksf) q = end bearing capacity of the pile Total end bearing = q x area (p d2/4) N = SPT-N value (per 30.48cm) c = 0.45 for pure sand c =0.35 for silty sand Martin, R. E, Seli, J. J., Powell, G. W. , and Bertoulin, M. 1987. Concrete Pile Design in Tidewater Virginia. ASCE Journal of Geotechnical Engineering 113(6):568-585. MGSS/workshop Dr Win Naing
End bearing capacity in Clay (driven pile) Skempton (1959) q = 9 . Cu q = end bearing capacity Cu = cohesion of soil at tip of pile Cf# Martin et al., 1987 q = C . N MN/m2 C = 0.20 N = SPT value at pile tip MGSS/workshop Dr Win Naing
End bearing capacity in Clay (bored pile) Shioi and Fukui (1982) q = C . N MN/m2 q = end bearing capacity C = 0.15 N = SPT value at pile tip MGSS/workshop Dr Win Naing
Unit Ultimate Bearing Capacity of pilesExample using NovoSPT MGSS/workshop Dr Win Naing
LiquefactionSandy and silty soils have tendency to lose strength and turn into a liquid-like state during earthquakes.This is due to increase in pore pressure in the soil caused by seismic waves. MGSS/workshop Dr Win Naing
Iris EQ web browser data Dr Win Naing GEOTECMINEX 2010 Singapore
CSR (cyclic stress ratio) or SSR (seismic stress ratio) Dr Win Naing GEOTECMINEX 2010 Singapore
CRR (cyclic resistance ratio): soil resistance to liquefaction A general rule is that any soil that has an SPT value higher than 30 will not liquefy. For clean sand with less than 5% fines, CRR7.5= 1/[34-(N1)60]+(N1)60/135+50/[10x(N1)60+45]2 – 2/200 CRR7.5 = soil resistance to liquefaction for an earthquake with a magnitude of 7.5 Richter Note: correlation factor is needed for other magnitudes MGSS/workshop Dr Win Naing
N1,60cs Dr Win Naing GEOTECMINEX 2010 Singapore
Summary of liquefaction Analysis(site classification for seismic site response) * below ground level (Vs1)cs = 87.7 [N1(60)cs]^0.253 ( after Andrus et al., 2003) Note: amplification is greater in lower velocity expected Site Period ≈ 1.0 s Dr Win Naing GEOTECMINEX 2010 Singapore
Comments on liquefaction analysis Thickness of penetrated surface layer is about 6.0m (after Obermeier et al., 2005) at both sites at 0.3g. Dr Win Naing GEOTECMINEX 2010 Singapore
CPT: cone penetration test MGSS/workshop Dr Win Naing
Cone Penetration Test MGSS/workshop Dr Win Naing
piezocones MGSS/workshop Dr Win Naing
GEOTECH AB MGSS/workshop Dr Win Naing
Details of a piezocone MGSS/workshop Dr Win Naing
CPT rig set up for operation Start CPT animation MGSS/workshop Dr Win Naing
Show Marina CPT example with NovoCPT MGSS/workshop Dr Win Naing
Measured & derived geotechnical parameters MGSS/workshop Dr Win Naing