Download
1 / 8
80 likes | 199 Views
What Surface Snow Rate Can be Detected from Space? Gail Skofronick Jackson, Code 612, NASA GSFC S. Joseph Munchak , University of Maryland/ESSIC and Benjamin T Johnson, University of Maryland/JCET.

E N D
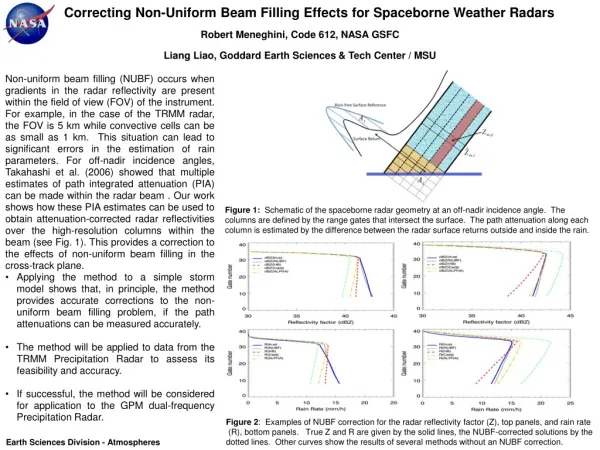
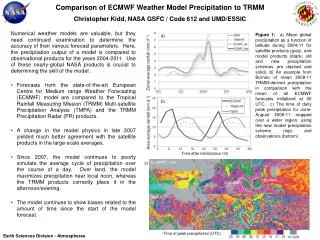
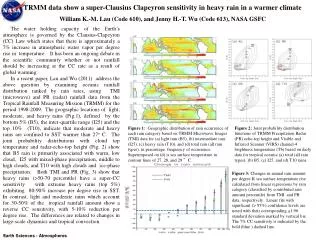
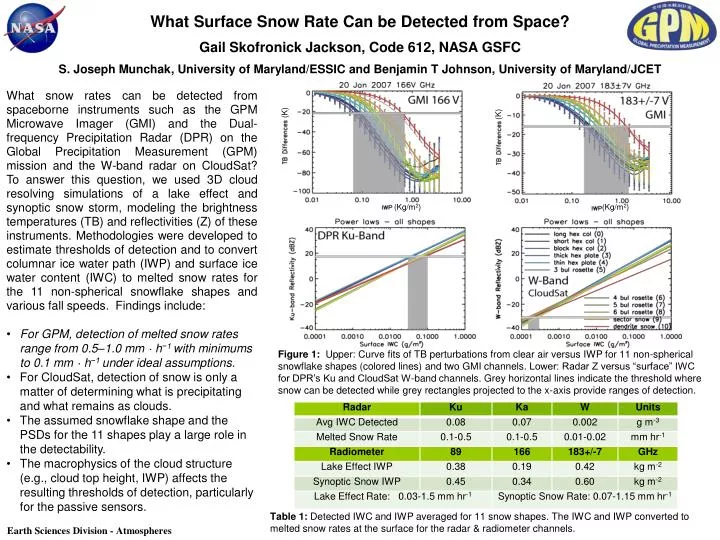
What Surface Snow Rate Can be Detected from Space?Gail Skofronick Jackson, Code 612, NASA GSFC S. Joseph Munchak, University of Maryland/ESSIC and Benjamin T Johnson, University of Maryland/JCET • What snow rates can be detected from spaceborne instruments such as the GPM Microwave Imager (GMI) and the Dual-frequency Precipitation Radar (DPR) on the Global Precipitation Measurement (GPM) mission and the W-band radar on CloudSat? To answer this question, we used 3D cloud resolving simulations of a lake effect and synoptic snow storm, modeling the brightness temperatures (TB) and reflectivities (Z) of these instruments. Methodologies were developed to estimate thresholds of detection and to convert columnar ice water path (IWP) and surface ice water content (IWC) to melted snow rates for the 11 non-spherical snowflake shapes and various fall speeds. Findings include: • For GPM, detection of melted snow rates range from 0.5–1.0 mm · h−1 with minimums to 0.1 mm · h−1 under ideal assumptions. • For CloudSat, detection of snow is only a matter of determining what is precipitating and what remains as clouds. • The assumed snowflake shape and the PSDs for the 11 shapes play a large role in the detectability. • The macrophysics of the cloud structure (e.g., cloud top height, IWP) affects the resulting thresholds of detection, particularly for the passive sensors. (K) (K) (Kg/m2) (Kg/m2) Figure 1:Upper: Curve fits of TB perturbations from clear air versus IWP for 11 non-spherical snowflake shapes (colored lines) and two GMI channels. Lower: Radar Z versus “surface” IWC for DPR’s Ku and CloudSat W-band channels. Grey horizontal lines indicate the threshold where snow can be detected while grey rectangles projected to the x-axis provide ranges of detection. Table 1: Detected IWC and IWP averaged for 11 snow shapes. The IWC and IWP converted to melted snow rates at the surface for the radar & radiometer channels. Earth Sciences Division - Atmospheres
Name: Gail Skofronick Jackson, NASA/GSFC, Code 612 • E-mail: Gail.S.Jackson@nasa.gov • Phone: 301-614-5720 • References: • [1] G. Skofronick-Jackson, Benjamin Johnson, and Joe Munchak: Detection Thresholds of Falling Snow from Satellite-borne Active and Passive Sensors, In press, 2013, Available online, IEEE Trans. Geoscience and Remote Sensing, Digital Object Identifier 10.1109/TGRS.2012.2227763 • [2] S. Joseph Munchak, Gail Skofronick-Jackson: Evaluation of precipitation detection over various surfaces from passive microwave imagers and sounders, Atmospheric Research, Available online 1 November 2012, ISSN 0169-8095, doi:10.1016/j.atmosres.2012.10.011. • [3] J. J. Shi, W.-K. Tao, T. Matsui, R. Cifelli, A. Hou, S. Lang, A. Tokay, C. Peters-Lidard, G. Skofronick-Jackson, S. Rutledge, and W. Petersen: WRF Simulations of the 20-22 January 2007 Snow Events over Eastern Canada: Comparison with in-situ and Satellite Observations, 2010. J. Appl. Meteor. Climatol., 49, 2246–2266. doi: 10.1175/2010JAMC2282.1 • Data Sources: • Weather Research Forecasting (WRF) simulations, Shi et al.,.[3] • GPM and CloudSat instrument specifications • Technical Description of Figure and Table: • Figure 1: Upper plots: Curve fits of TB perturbations (ΔTB) from clear air versus IWP for all shapes and for the channels of 166V GHz and 183±7V GHz for the Jan 20, 2007 Lake Effect simulation. Colored lines represent the different non-spherical shapes: long hexagonal column, short hex column, block hex column, thick hex plate, 3-, 4-, 5-, 6-bullet rosette, sector snowflake, and dendrite. One standard deviation error bars based on the variability of the vertical distribution of ice particles in the profile for a given IWP are plotted for the land curve fits. Gray horizontal lines indicate how well we can estimate clear air TB as based on our uncertainty of surface T, emissivity and T & RH profile used to compute TB [1]. When the uncertainty of the clear air TB is less than the signal from the falling snow in the atmosphere (ΔTB below gray horizontal lines) we can detect falling snow for passive radiometers. The projecting grayrectangles show the range of IWP detection for the various snow shapes. Radiometers measure integrated IWP. Lower plots: Radar reflectivity versus surface IWC for DPR’s Ku and CloudSat W-band radar channels. The thresholds of detection for radar are based on the minimum detectable Z of the instrument shown with the horizontal gray bar. Note that the projection to detectable IWC for W-Band is smaller than Ku (and Ka) by orders of magnitude. Radars measure IWC layer-by-layer within the cloud. For this analysis it was assumed that attenuation effects could be removed and that the modeled WRF data allowed us to sense to the lowest layers in the cloud. • Table 1: The detected IWC (radar, layer by layer) and IWP (radiometer) averaged for 11 snow shapes. Analysis of the WRF snow profiles showed that 25% of the IWP is in the lowest 500 m of the profile and this was used to convert detected IWP from the radiometer to surface IWC. The IWC for the radar and radiometer is converted to melted snow rates (SR) at the surface with SR= pw-1*Integral[mass(D)V(D)N(D)] where the mass and PSD (N(D)) is defined by the snowflake shape. Fall velocities (V(D)) came from Langleben (1954), Locatelli and Hobbs (1974), and Kulie and Bennartz (2009). Shallow (1-2 km tall) lake effect events are more difficult to detect while the tall (7-8 km) synoptic clouds are easier because they have large TB perturbations. • Scientific significance: The GPM core satellite, in conjunction with a constellation of microwave sensors from international partners, will provide instantaneous precipitation estimates over 90% of the globe with a 3-hour or less revisit time. This research provides information on what snow rates can be detected from the various passive channels on the GPM Core satellite as well as the constellation satellites. The paper also identifies minimum snow rates that can be retrieved from CloudSat and the GPM radars. • Relevance for future science and future missions : This study highlights snow rates that cannot be detected due to instrument characteristics and unknowns in the physical to retrieval process. For future missions to capture the full spectrum of rain and snow rates, instrument specifications need to be examined and algorithm retrievals improved. Earth Sciences Division - Atmospheres
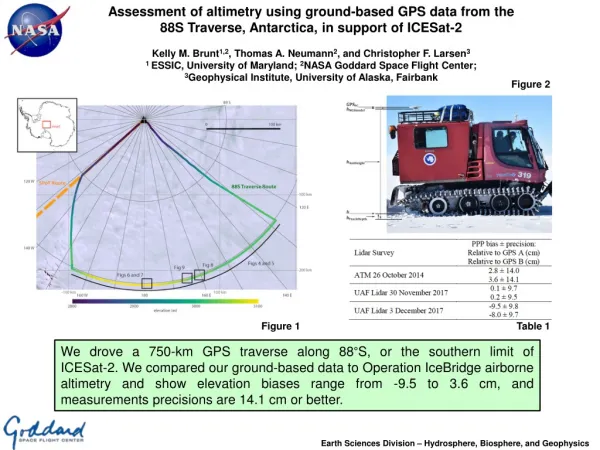
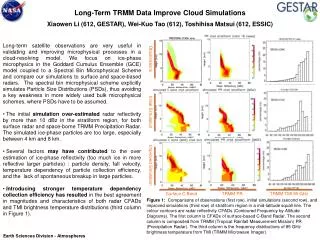
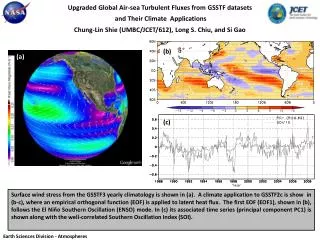
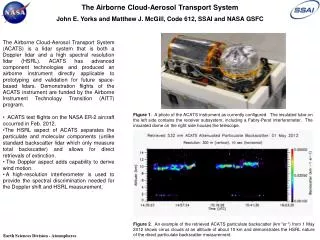
New Capabilities for Cloud/Aerosol Measurements - ACATSJohn E. Yorks, Code 612, SSAI and NASA GSFC Figure 1. A photo of the ACATS instrument as currently configured. The instrument is built for the ER-2 superpod. • Cloud and aerosol properties have a significant influence on the Earth’s climate system. Obtaining an accurate assessment of cloud and aerosol properties and their influences on the atmospheric radiation budget remain a major challenge in understanding and predicting the climate system. The Airborne Cloud-Aerosol Transport System (ACATS) is a lidar system that is both a Doppler lidar and a high spectral resolution lidar (HSRL), allowing for simultaneous measurements of cloud/aerosol properties and particle motion. • First science flights on the ER-2 as part of the Wallops Airborne Vegetation Experiment (WAVE) during September 2012. • Both cirrus clouds and smoke plumes were overflown with ACATS and the Cloud Physics Lidar (CPL) during WAVE. • The HSRL aspect of ACATS separates the particulate and molecular components (unlike standard backscatter lidar which only measure total backscatter) and allows for direct retrievals of extinction. • First demonstration of this Doppler wind/HSRL method from high altitude aircraft. Figure 2. A curtain plot of the ACATS photon counts from 26 Sept. 2012 demonstrates the instrument’s ability to rotate to 4 different look angles during flight to measure wind speed. Cirrus clouds are observed at an altitude of 10-12 km. Smoke Figure 3. An example of the retrieved ACATS attenuated total backscatter (km-1sr-1) from 26 Sept. 2012 shows both clouds at altitudes above 5 km and a smoke plume below 5 km. Directly retrieved particulate extinction (km-1) for the same flight demonstrates the HSRL nature of the ACATS. Clouds Earth Sciences Division - Atmospheres
Name: John E. Yorks, NASA/GSFC, Code 612 and SSAIE-mail: John.E.Yorks@nasa.gov Phone: 301-614-6284 Yorks, J. E., M. McGill, V.S. Scott, D. Hlavka and W. Hart, A High Altitude Cloud-Aerosol Transport Lidar System, Proceedings of the 25th International Laser-Radar Conference, Saint Petersburg, Russia, July 5-10, 2010. McGill, M.J., W.R. Skinner, and T.D. Irgang, "Analysis techniques for the recovery of winds and backscatter coefficients from a multiple channel incoherent Doppler lidar," Appied Optics, 36, 1253-1268, 1997a. Data Sources: The Airborne Cloud-Aerosol Transport System (ACATS) data products are still currently under development. Here, the backscatter data is averaged to a 400 m horizontal resolution and 40 m vertical resolution. The HSRL products, such as extinction, are averaged to 5 km horizontal resolution and 450 m vertical resolution. The ACATS data was collected during the WAVE campaign in Sept. 2012 out of Wallops Island, VA. Technical Description of Figures: Figure 1. A photo of the ACATS instrument as currently configured. The insulated dome on the right side houses the 8 inch telescope, which collects the backscattered light at a 45 degree view angle and passes it through to the receiver subsystem (the insulated tube on the left side). The primary difference between a lidar system capable of only measuring total signal intensity (e.g., CALIPSO) and an instrument that directly measures particulate extinction and Doppler shifts (e.g. ACATS) lies in the receiver subsystem. An etalon provides ACATS with the spectral resolution needed to resolve the HSRL measurement and the Doppler shift inherent in the backscattered signal. Figure 2. A curtain plot of the raw photon count data from the ACATS instrument for a 5-minute segment of the 26 Sept. 2012 flight during the WAVE campaign shows cirrus clouds observed at 4 different look angles. To retrieve the horizontal wind velocity and direction, orthogonal LOS wind measurements are needed. Thus, the ACATS telescope rotates to 4 different look angles (0, 90, 180, 270 degrees). Figure 3. An example of the retrieved ACATS attenuated total backscatter (km-1sr-1) from 26 Sept. 2012 shows water and ice clouds between 5 and 12 km, as well as a smoke plume below 5 km (top). The extinction (km-1sr-1) for the same flight is also plotted (bottom) and agrees well with coincident CPL. ACATS instrument directly retrieves profiles of extinction and coincident CPL data will be used to compare cloud/aerosol properties from all the Sept. flights. Scientific significance: Cloud and aerosol properties have a significant influence on the earth’s climate system. Obtaining an accurate assessment of cloud and aerosol properties and their transport remain a major challenge in understanding and predicting the climate system. The ACATS data products have a large range of applications to significant climate system issues, such as examining cirrus optical properties and convective outflow in tropical storms, assessing dust and smoke transport, and investigating cloud-aerosol interactions and radiative effects. Relevance for future science and future missions: ACATS should contribute to future space-based missions by advancing component technologies and by producing an airborne instrument directly applicable to prototyping and validation for NASA’s Cloud-Aerosol Transport System (CATS), Aerosol-Cloud-Ecosystem (ACE) and 3-D Winds missions. For example, the current algorithm development for ACATS data products will be used for algorithm development of the International Space Stations (ISS) CATS instrument. Earth Sciences Division - Atmospheres
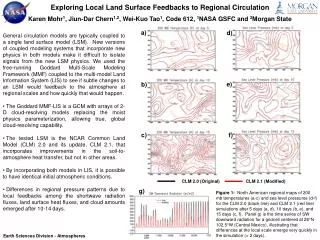
Eyjafjallajökull Volcano Plume Particle-type Characterization From Space-based Multi-angle ImagingRalph A. Kahn1 & James A. Limbacher1,2, 1Code 613, NASA GSFC; 2Science Systems & Applications Inc. At any one time, about a dozen volcanoes are erupting somewhere on Earth. Although the ash particles and gases emitted can affect the local and regional environment as well as global climate, most active volcanoes are unmonitored, except by space-borne instruments. So extracting as much information as possible from satellite data is a priority. The NASA Earth Observing System’s Multi-angle Imaging SpectroRadiometer (MISR) viewed Iceland’s Eyjafjallajökull volcano during its spring 2010 activity, a series of eruptions that curtailed air traffic over Europe, and brought at least the immediate potential hazards of such events to public attention. Plume heights derived from MISR’s stereo observations show particles injected to over 6 km at times during the five weeks of activity. Using the MISR Research Aerosol Retrieval algorithm, we pushed the information-content limits of the MISR data, demonstrating the ability to map detailed volcanic plume structure for several events. The plume particles are distinct from background – much more abundant, more angular, and larger in size. The analysis also provides some indication that the plume particles evolve as they age, becoming brighter and decreasing in average size. The MISR global data record extends over more than 13 years, offering the potential for systematic studies of volcano environmental impacts. b a 6 Figure 1: (a) MISR true-color image of the Iceland volcanic plume on 7 May 2010, with map inset. (b) Plume height, derived from MISR multi-angle stereo imagery, using the “MINX” algorithm. Note the near-surface (blue) plume of re-mobilized ash blown toward the southwest. 4 2 3.5 0.5 0 Fr. Sph. Non-absorb. AOD km 2.0 0.3 a b 0.5 0.1 0.5 0.5 Fraction Grains Fraction “Cirrus” 0.3 0.3 d c 0.1 0.1 Figure 2: Four panels showing MISR particle property retrieval results for the May 7 plume: (a) Aerosol amount (AOD); and fraction AOD of: (b) spherical non-absorbing; (c) medium dust-like angular grains; and (d) large, non-spherical “cirrus” optical analogs. Earth Sciences Division - Atmospheres
Name: Ralph Kahn, NASA/GSFC, Code 613 E-mail: ralph.kahn@nasa.gov Phone: 301-614-6193 References: Kahn, R.A., and J.A. Limbacher, 2012. Eyjafjalljökull Volcano Plume Particle-Type Characterization from Space-Based Multi-angle Imaging. Atmospheric Chemistry & Physics 12, 9459–9477, doi:10.5194/acp-12-9459-2012. Scollo, S. R.A. Kahn, D.L. Nelson, M. Coltelli, D.J. Diner, M.J. Garay, and V.J. Realmuto, 2012. MISR observations of Etna volcanic plumes. Journal of Geophysical Research 117, D06210, doi:10.1029/2011JD016625. Acknowledgements: This research is supported in part by NASA’s Climate and Radiation Research and Analysis Program under H. Maring, NASA’s Atmospheric Composition Program under R. Eckman, and the NASA Earth Observing System MISR instrument project. Data Sources: NASA-MISR L1B2-Radiance, L2AS-Aerosol, L2TC-StereoHeight, MINX, and Research Aerosol Retrieval products; NASA-MODIS context imagery; AERONET sun photometer spectral optical depth; NASA-MERRA Re-analysis & NOAA-HYSPLIT trajectories; DLR-Falcon aircraft in situ aerosol property data; EARLINET lidar. Technical Description of Figures: Figure 1: Thirty-six near-simultaneous images of the 7 May 2010 eruption plume were acquired by MISR – nine view angles spanning 70˚ forward, through nadir, to 70˚ aft along the spacecraft track, in each of blue, green, red and one near-infrared bands, at a spatial resolution between 275 m and 1.1 km, depending on channel. From the hyper-stereo, a purely geometric retrieval of contrast-feature elevation along with height-resolved wind vectors is obtained. In the case of this image, the MISR INteractiveeXplorer (MINX) software was used, a program that generates high-quality heights and wind vectors for any image features that can be identified in multiple, angular views. An operator is required to locate the plume and indicate wind direction. Figure 2: The MISR multi-angle, multi-spectral radiometric data contain information about the amount, size, shape, and brightness of airborne particles over land and water. The MISR Research Aerosol Retrieval algorithm makes it possible perform retrievals with much greater flexibility than the MISR Operational algorithm, including higher spatial resolution and more detail about aerosol particle properties, at the cost of hands-on effort. These images show maps of retrieved aerosol optical analogs, indicating that the volcanic plume contains much greater fractions of non-spherical and larger particles than the background aerosol. Detailed examination demonstrates that particle properties evolve in ways generally expected for such plumes. These results are unique, as there is a lack of in situ validation data even for this famous plume, illustrating the gap that global satellite volcano monitoring fills. Scientific significance: In addition to the immediate air traffic and possibly regional health hazards that volcanic plumes pose, they also contribute to the load of atmospheric aerosols, which affect Earth’s energy balance directly, by reflecting and in some cases absorbing sunlight, and altering clouds. As such, volcanic ash, and sulfate particles that form from emitted sulfurous gas, can impact global-scale climate in ways that are not yet well quantified. Relevance for future science and future missions: This work demonstrates the value that can be extracted from the existing MISR data set, directly relevant to climate studies to which NASA contributes. It is also relevant to future missions that aim to advance our ability to quantify aerosol impacts on climate, notably the ACE mission, but also CLARREO, GeoCAPE, and OCO-2, that must account for aerosols when retrieving carbon dioxide abundances. Earth Sciences Division - Atmospheres
Breakthrough in the retrieval of terrestrial chlorophyll fluorescence from space J. Joiner1, L. Guanter2, R. Lindstrot2, M.Voigt2,A. Vasilkov1,3, E. Middleton1, F. Huemmrich1,4, Y. Yoshida1,3, C. Frankenberg5 1NASA Goddard Space Flight Center, 2Free University of Berlin, 3Science Systems and Applications, Inc. (SSAI), 4University of Maryland, Baltimore County (UMBC/JCET), 5Jet Propulsion Laboratory Since making the first global maps of terrestrial chlorophyll fluorescence in 2011 with GOSAT, our group has pioneered a new approach to more accurately retrieve fluorescence with moderate spectral resolution instruments, here applied to the Global Monitoring Ozone Experiment (GOME-2) that flies on EUMETSAT’s operational polar-orbiting weather satellites. In morning sunlight, fluorescence is correlated with photosynthesis. Fluorescence measurements provide estimates of instantaneous photosynthesis that are highly correlated with gross primary productivity (GPP). Fluorescence is thus complementary to the greenness signal from reflectance-based vegetation indices that are related to potential photosynthesis. a: May 10-20 2009 b: May 20-31 2009 Fluorescence shows declines in photosynthetic activity before reductions in greenness take place and is therefore of interest for precision farming, forestry, terrestrial ecosystem science, and carbon assessment. Fluorescence is a value-added product derived from instruments not designed to measure it. Researchers are now beginning to tap this new source of information related to canopy structure and plant physiology. These GOME-2 data will enable new studies on vegetation phenology and responses to stress including those due to climate change. c: June 1-10 2009 Figure 1: These global maps show for the first time a progression of the 740 nm fluorescence signal over a month (gridded at 0.5o X 0.5o) and the high precision that can be obtained in a monthly average with GOME-2. The coverage and precision are vastly superior to what has been achieved previously with GOSAT. d: July 2009 Earth Sciences Division - Atmospheres
Name: Joanna Joiner, NASA/GSFC, Code 614 E-mail: Joanna.Joiner@nasa.gov Phone: 301-614-6247 Reference: Joiner, J., Guanter, L., Lindstrot, R., Voigt, M., Vasilkov, A. P., Middleton, E. M., Huemmrich, F., Yoshida, Y., and Frankenberg, C., 2013: Global monitoring of terrestrial chlorophyll fluorescence from moderate spectral resolution near-infrared satellite measurements: methodology, simulations, and application to GOME-2, Atmos. Meas. Tech. Discuss., 6, 3883-3930, doi:10.5194/amtd-6-3883-2013. Data Sources: Global Ozone Monitoring Experiment 2 (GOME-2) on the EUTMETSAT MetOp-A (and now also MetOp-B) platforms. Technical Description of Figure: The new retrieval technique that enables these images uses a wavelength range between 712 and 783 nm with a principle component approach to remove the spectral component due to atmospheric absorption. Simulations in Joiner et al. (2013) demonstrate that this approach can be used to accurately retrieve fluorescence with moderate spectral resolution instruments such as GOME-2. We show that good coverage and precision can be obtained in 10 days with GOME-2. Now, with the recent launch of a 2nd GOME-2 instrument on MetOp-B in orbit with a time different of 45 minutes from the GOME-2 on MetOp A, even better coverage and precision can be obtained. These observations will enable researchers to study the temporal and spatial variations in fluorescence with unprecedented precision. Scientific significance: Remote sensing of terrestrial vegetation fluorescence from space is of interest because it can potentially provide global coverage of the functional status of vegetation. For example, fluorescence observations may provide a means to detect vegetation stress before chlorophyll reductions take place. Although there have been many measurements of fluorescence from ground- and airborne-based instruments, there has been scant information available from satellites until our initial work with GOSAT. Since then, several other groups have been working with GOSAT data and various methods have been employed to correct for instrumental artifacts. In this work, we use GOME-2 and show that superior coverage can be obtained, providing higher spatial and temporal fluorescence retrievals that can be used for studies in terrestrial ecology including investigations related to plant phenology and productivity. Previous studies with GOSAT have shown that fluorescence is highly correlated with estimates of GPP, although much averaging in time and space was needed to make the comparisons. This work is an important step forward in demonstrating that the health of terrestrial ecosystems can be monitored from space. Our research provides a basis for future satellite missions specifically designed to measure vegetation fluorescence such as the Florescence Explorer (FLEX) mission that was selected for assessment by the European Space Agency (ESA) in 2006. Finally, our work shows that potentially lower cost instrumentation (moderate spectral resolution) can be used to derive fluorescence information from aircraft, ground, and space. Relevance for future science and future missions: It will also be possible to retrieve fluorescence using the NASA Orbiting Carbon Observatory-2 (OCO-2) to be launched in the next few years. It will be interesting to compare the morning GOME-2 fluorescence with that from OCO-2 in the afternoon. There is currently no decadal survey mission specifically designed to measure fluorescence. Earth Sciences Division - Atmospheres