REX Software Architecture
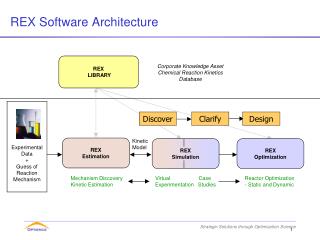
Discover. Clarify. Design. REX Software Architecture. REX LIBRARY. Corporate Knowledge Asset Chemical Reaction Kinetics Database. Kinetic Model. REX Estimation. REX Simulation. REX Optimization. Experimental Data + Guess of Reaction Mechanism. Mechanism Discovery

REX Software Architecture
E N D
Presentation Transcript
Discover Clarify Design REX Software Architecture REX LIBRARY Corporate Knowledge Asset Chemical Reaction Kinetics Database Kinetic Model REX Estimation REX Simulation REX Optimization Experimental Data + Guess of Reaction Mechanism Mechanism Discovery Kinetic Estimation Virtual Case Experimentation Studies Reactor Optimization - Static and Dynamic
REX Architecture • REX_Library and REX_Projects are independent products • Each Company can set up their own REX_Library • REX_Projects has access to the Database for the REX_Library, so that users can import information from the Library(optional)
REX Software Architecture • Database oriented • All Project Information is stored in a Relational Database rather than in individual project files • User Interface • Built on the Optience Core Platform • What is Optience Core Platform ? • A user interface builder engine that: • Allows User to Connect to Databases, Mathematical Solution Engines • Allows to conveniently interact with the Database in order to add, modify and manipulate its content • The platform for building most applications at Optience
Optience REX Software Architecture OPTIENCE CORE PLATFORM REX_Projects Mathematical Models and Solution Engines REX_Projects User Interface (.core)File Database DB Engine Data Architecture + Data Storage REX_Library Mathematical Models and Solution Engines REX_Library User Interface (.core)File Database DB Engine Data Architecture + Data Storage [………] [………]
On REX Installation • Typical Installation in : • C:\Program files\Optience Corporation\REX Suite • Optience Core Components • \REX DBs • All Project Data is stored here : REX_Projects.mdf • Default local REX Library is stored here : REX_Library.mdf • \REX UIs • User Interface Components : • REX_Projects.core • REX_Library.core • \REX Models • Mathematical models and solution engine files • \REX DLLs • Associated Dynamic Link Libraries
F1 key Help for Active Grid Tabs Typical screen in REX Projects(1) – Tree based Help for Active Application Tree Refresh Save Formats (Disabled) APPLICATIONS VIEWS RUN-TIME TREE GRIDS FILE BAR DB Engine on Desktop
A typical View in REX Projects(2) • The File Bar and Run-Time Tree may be hidden to save screen space. They ‘reappear’ on a mouse ‘move over’
REX Projects • Top Menus • Such as File, Edit, View Help are associated with the Core Platform • Example: “File -> Open” will be used only if we send you a New Optience product that you need to open in Core Platform • Using REX_Projects • Top Menus will be rarely needed • All user interaction is in the Views, Tree Nodes, Grids, and Actions • (Action is the PopUp Menu on Right Clicking a tree node) • Nodes with Actions are suffixed with “>>” characters • Example – Adding a Project • Go to Project Explorer View – Projects Node • In the Available Projects Grid – Add a new project • Go to the New Project Node – Fill the tree for the project
Project Data Entry • As you build your estimation project, data is saved automatically to the REX_Projects.mdf file in your REX DBs directory • All projects are saved in the same place, so when you open REX_Projects, you will automatically see all the projects in the database • Techniques to export, import, backup and manipulate projects will be shown later
Additional Information • See the REX_Projects help Documentation – F1 on any grid gives information specific to that grid
Estimation with REX Ethylene Oxide to Ethylene Glycol Purpose Explaining the basic procedure to use REX
Kinetic Estimation with REX Suite-I • Objective • Learn Problem Setup for Estimation Projects • Tutorial with a simple example. • Ethylene Oxide Hydration to Ethylene Glycol* • If you have REX on your PC, you may follow along • Illustrates the estimation of kinetics from Batch Reactor Data • Experiments in aqueous excess with H2SO4 cat. • Data trend shows H2O effect on reaction negligible *From Fogler et. al, Elements of Chem. Reaction Engineering
REX Projects - Project Explorer View • Add a project EOEG • Note the following behavior in every grid • New information entry has an * in the row header • When editing, the * changes to a pencil: • To enter the information, hit <Enter> OR Click on the pencil • To undo, hit ESC
REX Projects – Project Explorer View • Here the projects that are ‘active’ are displayed in a tree • Select Project: EOEG • Note the information grids in the right • Before we continue, a brief explanation on color coding and common features
REX Color Codes • REX has three different formats of grids with three different colors respectively. • Orange: Orange grids are independent grids and they are used to insert or to show the key information in each node • Blue: Blue grids are dependent grids. A blue grid usually shows information for a row selected in an Orange grid. • Gray: Gray grids are OPTIONAL documentation grids, and they show additional information which it is not necessary for the modeling. These grids usually have an {i} symbol in their Caption. • REX uses 3 font colors • Black font is used to show data that can be inserted or modified. • Blue font is used to show data that is ‘Read only’ information • Red font is used to show inconsistent data.
REX Color Codes & Help • You may select help with the F1 key on any grid • You may • Filter information in a grid: By right-clicking on the Grid and selecting filter • Arrange by columns such as type by selecting the “Group by” popup, and dragging a column to the gray area • RESET LAYOUT (an Action on Node Right Click) will reset everything to the default • Very useful after modifying default options (OR) • When the layout format looks abnormal
Restoring Default Layout • When several layout changes have been done, they can be reverted by the “View Layout Reset Layout for All Nodes” option:
Project EOEG - Compounds • We will add three compounds directly • Ethylene-Oxide (ETO), Ethylene-Glycol (ETG) and Water • A note on import from REX Library (not commonly used) • If we had the EOEG Reaction Set in the Library, we could import the chemistry directly • Check Enable Library in the Projects Node • Under Chemistry Import from Library : • Check the ‘Select’ column for the desired Reaction Set • Execute Action “Import Reaction Set” • Similar procedure if you wish to only import Compounds • Under Compounds Import from Library:
Reactions • Add reaction by name: EtOtoETG • Describe this reaction in the Stoichiometry Grid • EtO + H2O EtG
EOEG project • Browse through the catalysts and conditions {i} grids • Enter Kinetics: • Select • Rate Equation; Mass Action • Specific Rate: Arrhenius • Include Flag: • Note that only forward reactions are included by default • Allows you to keep a reaction but make it kinetically absent • For example, you may want to test a simulation by removing a reaction, instead of deleting it and writing it again, you may just change the include flag.
Units Configuration • Purpose: Change the Units of the Basic Variables • What does REX do with this information ? • REX uses this basic information to come up with the units for derived variables and show them • For example: If Volume Units are in lit, Time in sec, Moles in mmol, Rate basis is Volume, REX will ask the user to provide • Concentrations in mmol/lit • Flows in lit/sec • Rate Expressions in mol/lit-sec • …. and so on. • REX attempts to display units clearly to the user in all data sheets to avoid potential mistakes in data entry • Units Conversion is also performed here • Check the “Convert Data when changing units” box. • This converts all project data from old units to the new units
Kinetics Parameters >> • Reminder: A node with “>>” means it has an action in it • Click on “Initialize Orders” • This sets the initial orders to be the same as the molecularity: • Reset the H2O order to zero since H2O is in excess and data trend analysis shows no impact of H2O • Enter some estimate of PreExponential Value -> Better to initialize away from 0
EOEG • LHHW and Kinetics Sites • These are locked because there are no LHHW reactions • Notes • Optional Description of Chemistry is now complete • Proceed to Estimation: • Activate Reactions to be Estimated
EOEG Project • Estimation Kinetics • Execute >> • Initialize Bounds Current Values Variables : All • Set PreExponential Factor Bounds between 0 and 1000%. Initial value at 0.1 or any non-zero number • So, we are now estimating only the pre-exponential factor • Reactor • Reactor Type : Batch , PFR, n-CSTR • Phase : Single Liquid Phase, Single Gas Phase, Multiphase • Volume : Constant, Interpolate from Data, Use Density • Temperature : Constant, Interpolate from Data, Use Energy Balance • Pressure : Free • Fedbatch flows and Outflows : No, Yes
EOEG Project • Skip Flows and their sub-nodes • Fedbatch flows have been set to No • Proceed to Experiments • First Grid: Documentation • Document the Experiment Design • Lets assume the design is for varying inlet concentration of EtO
EOEG project • Design Description • We will add just one set (set1) with a design EtO value of 1 gmol • Experiments Measurements • Select the following as measured variables
EOEG Project • Measurements Set1 moles • You may add data points for the batch reactor one-by-one automatically • Or • >>Execute Action “Add datapoints” • This allows you to add a few records and copy from excel • We will add “6” additional DataPoints and copy the information below
EOEG Experiments • Experimental Data
Weights • Select only Ethylene Glycol for Reconciliation • The Grid Auto Generation Options shows different strategies for weighting • Uniform absolute error All measurements are assumed to have equal measurement error. So smaller measurements tend to get less importance. • LSQ objective = Si(Measi-Calci)2 • Uniform percentage error All measurements are assumed to have equal percentage error. The square of this fractional error is minimized. Here, a 0.01 fit error in a measurement value of 0.1, is weighted 100 times more than a 0.01 error in a measurement value of 1. • LSQ objective = Si [ (Measi-Calci)2/ Measi2 ] • Hybrid: (Most common) Middle strategy between Uniform absolute and Uniform Percentage. • LSQ objective = Si [ (Measi-Calci)2/ Measi ]
EOEG - Weights • Select “Uniform Absolute Error” • Execute Action : AutoGenerate • Note the History tab • Keeps history of alteration of the weights • See the generated weights in the Sets child node • You may change the weights here through the “Modify Weights” action or direct editing • Unselecting the include flag for a point removes that point from consideration in the estimation • Ready to now Run the Estimation model • Before Running check for errors by: • ‘Run Estimation Check Model’
To Run the Model, click the triangular play button Run Options VCR Buttons Purpose of saving is for technical support. You can save the run as an MOS file and email it, in the event of convergence problems Save Run Interrupt Run Cancel EOEG – Run Estimation
Results • View Parameters
Results • Model-Data Comparison • Two tabs are available: Values and Charts • Select Charts • Select Sets to View • View Charts showing measured versus calculated values • Double Click on Chart to customize chart styles • Charts can be copied and pasted into Office programs • Try “Parity Plots” to see an overall comparison between measured and calculated profiles • Perform “Single Set” action to be able to display several compounds together for a given experiment set
Tuning the Solution Methods • Under Run Estimation • Check Model • Solution Options • Initialization Values • You may input the initial values here or • Load them from the previous solution • Estimation Initialize from Results • Try the EOEG example with profiles initialized by the previous results
Manipulating Projects (1) • By Default, all projects are stored in the REX_Projects.mdf • Now, we will learn to export and import projects • From both Projects Node and Each Project
Manipulating Projects (2) • Most Export / Import activities are performed by Right Click Actions • Choosing “False” for ‘Export results’ on export can save time and reduce the file size • Likewise, choosing false for importing results can save time • You may also create a copy of a project by selecting the Copy action on the Project Name
Manipulating Projects (3) • Project Manipulation through Action menus • Action Menus are also available in the Project Catalog. These menu buttons allow you to perform import, export and common project operations with a single click. Moving mouse over them shows the relevant actions
Task: Project Actions with EOEG project • Export the project from Project Explorer • Re-import the project into your workspace • Rename the Project • Adding another experiment • In Experiments node, check the Mark Column for set1 • Execute the “Copy Marked” Action • All information related to the set from Experimental Data to Initialization Values and weights are copied • (You may edit this experiment and then run the model)
Nifty Utilities • Copying whole sheets • Click on top left corner – [CTRL–C] • Copying a column • Click on column header – [CTRL-C] • Editing a cell • Single F2 selects everything in cell • Two consecutive F2 places cursor at last point in text • ESC reverts changes to a cell • Selection of a Cell Range now available by many methods • Drag and select , SHIFT-Arrows • Copy/Paste • Keyboard (CTRL-C/V), Edit Menu, Toolbar Buttons