Download
1 / 23
230 likes | 377 Views
CLIMATE Change Indicators: Upper Atmosphere. Changes occurring in the Lower Atmosphere (Troposphere) . Arctic sea ice Glaciers Lake ice Snow cover Snowpack Growing season Plant hardiness Leaf/Bloom dates Bird wintering ranges. Global Temperatures GHG emissions

E N D
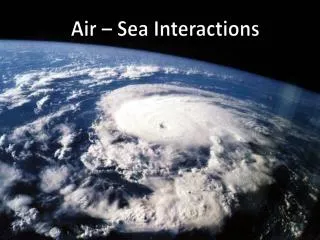
Changes occurring in the Lower Atmosphere (Troposphere) • Arctic sea ice • Glaciers • Lake ice • Snow cover • Snowpack • Growing season • Plant hardiness • Leaf/Bloom dates • Bird wintering ranges • Global Temperatures • GHG emissions • Heat waves • Drought • Precipitation • Flooding • Cyclones • Sea Surface Temp • Sea level • Ocean acidification
It’s easy to notice or hear about change when it’s happening around you (in the troposphere) What about the other layers of the atmosphere? Are changes occurring there?
How is the upper atmosphere measured from the ground? Incoherent Scatter Radar • RADAR (RAdio Detection And Ranging) is a technique for detecting and studying remote targets by transmitting a radio wave in the direction of the target and observing the reflection of the wave • Target of incoherent scatter radar is electrons in the earth's ionosphere rather than a discrete hard target (like an airplane) • High energy ultraviolet radiation from the sun removes electrons from some of the atoms and molecules in this region, and these electrons can scatter radio waves • Amount of energy scattered from each electron is well known, the strength of the echo received from the ionosphere measures the number of electrons in the scattering volume • Scattering technique can determine density, temperature, velocity, and composition of the charged upper atmosphere [ionosphere]
2000 MIT Haystack Where are Incoherent Scatter Radars? This map shows all of the world's operational incoherent scatter radars There are only 9 worldwide (as of 2000)
Millstone Hill • Located in Westford, MA • Capable of making observations ranging from 90 to 1000 km in altitude • Radar system • A fixed vertically pointing antenna (Zenith) uses megawatt transmitter and 68 m diameter fixed antenna [1963 - now] • A fully steerable antenna (MISA), 46 meter diameter [1978 – now] • SWFX 5 MIT Haystack
EISCAT/ESR • European Incoherent Scatter Scientific Association • It operates three incoherent scatter radar systems • Two in Northern Scandinavia • One in Svalbard Wikipedia | Credit Tom Grydeland
Arecibo • Radio Telescope located in Puerto Rico • 305 m in diameter (largest single-aperture telescope) • Makes frequent appearances in movies and TV shows NOAA accessed via Wikipedia
Jicamarca Radio Observatory (JRO) • Studies the equatorial ionosphere in Lima, Peru • Main antenna is the largest of all the incoherent scatter radars in the world • 300m x 300m square array Wikipedia | Public Domain
NASA Upper Atmosphere Satellite Projects The Mission The Instrument • TIMED - Thermosphere, Ionosphere, Mesosphere, Energetics and Dynamics • Developed to explore Earth’s atmosphere above 60 km • Launched December 2001 • SABER - Sounding of the Atmosphere using Broadband Emission Radiometry • Aboard TIMED • Designed to measure energy budget of the mesosphere and lower thermosphere • Collected data over 8 years NASA
Cutting Edge Research … • ~40 years (1968 – 2006) of ionospheric data taken from the Millstone Hill Incoherent Scatter Radar is used • MIT scientists have been studying, analyzing and interpreting the results • Here is what they have discovered …
What trend do you notice? Zhang, Shun-Rong | MIT Haystack
MIT Scientists state a +1.9K/year • Zhang, Shun-Rong | MIT Haystack
What trend do you notice? • Zhang, Shun-Rong | MIT Haystack
MIT Scientists state a -1.2 K/year • Zhang, Shun-Rong | MIT Haystack
What trend do you notice? • Zhang, Shun-Rong | MIT Haystack
MIT Scientists state a -3.2 K/year • Zhang, Shun-Rong | MIT Haystack
Altitude vs. Ion Temperature % change per decade There is more error in the lower atmosphere because there are fewer measurements made The temperature profile indicates a DECREASE in ion temperature in the upper atmosphere above 200km • Zhang, Shun-Rong | MIT Haystack
Let’s Compare LOWER ATMOSPHERE UPPER ATMOSPHERE Things are heating up … • Average global temperature has increased at a rate of roughly 0.15 - 0.20°C per decade over the past 40 years • This seems small, but has triggered many changes (polar cap melting, etc.) Things are cooling down … • Trend shows a 2 - 3˚C decrease per decade over the past 40 years • Change is much bigger (10X!) than in the lower atmosphere • Total change is readily observable in data record
What is causing the Upper Atmosphere to cool? The answer is Radiative Cooling • Process by which a body loses heat by radiation • Greenhouse gases(particularly CO2) radiative effects become more pronounced and produce a cooling effect in the upper atmosphere Lastovicka et al. “Global Change in the Upper Atmosphere.” Sciencev.314 no.5803 (24 November 2006) pg. 1253 – 1254.
Active and Ongoing Research • The upper atmosphere is an area that requires further studied • More data is needed to confirm the observed trends • Observed change in upper atmospheric temperature is large, which makes it easier to measure Photo taken by Shun – Rong Zhang | used with permission